Cambodian vs Yugoslavian Kindergarten
COMPARE
Cambodian
Yugoslavian
Kindergarten
Kindergarten Comparison
Cambodians
Yugoslavians
98.1%
KINDERGARTEN
91.2/ 100
METRIC RATING
131st/ 347
METRIC RANK
98.2%
KINDERGARTEN
95.5/ 100
METRIC RATING
118th/ 347
METRIC RANK
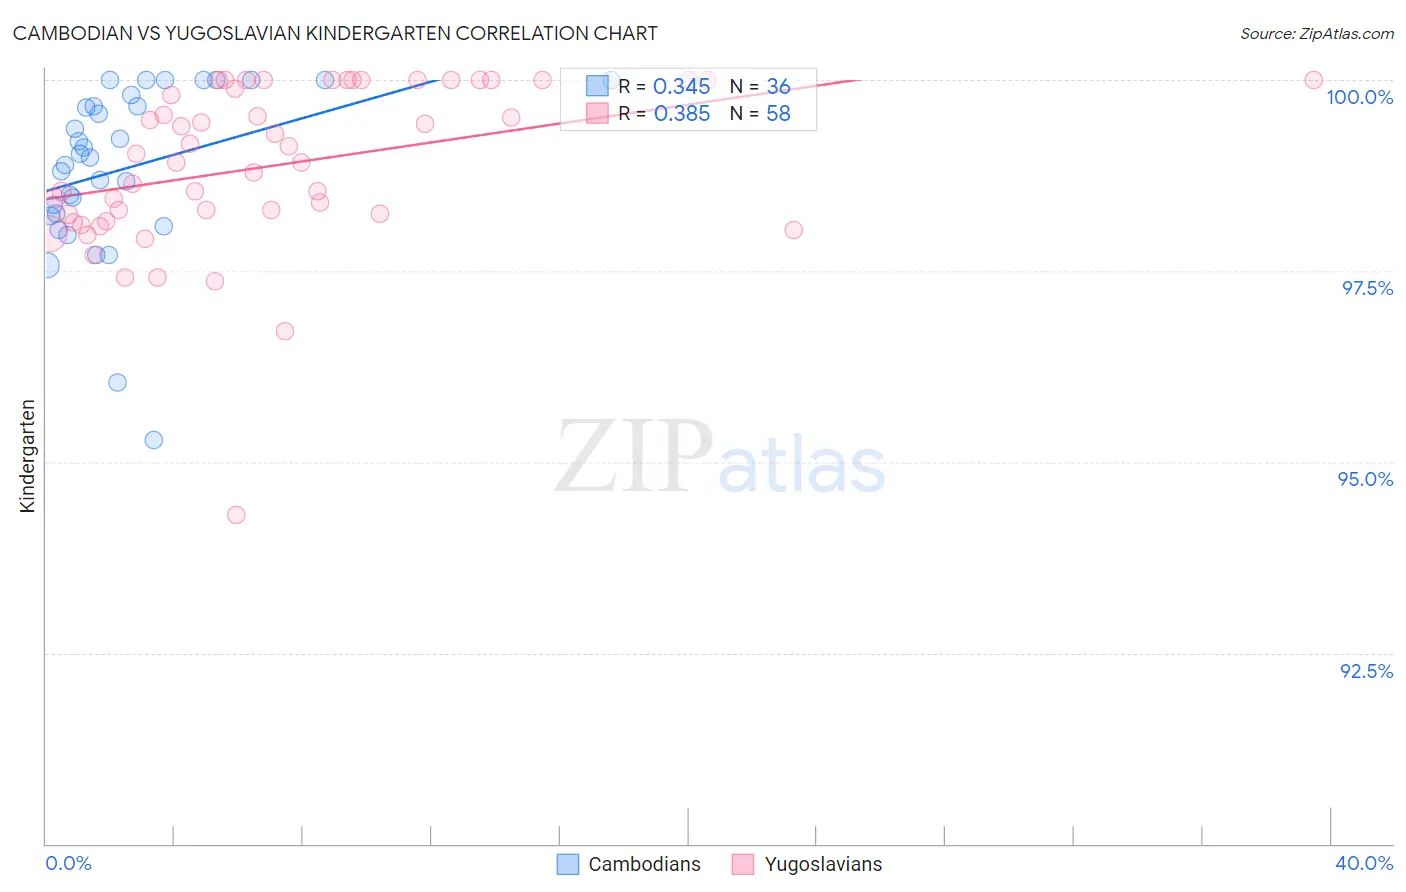
Cambodian vs Yugoslavian Kindergarten Correlation Chart
The statistical analysis conducted on geographies consisting of 102,511,743 people shows a mild positive correlation between the proportion of Cambodians and percentage of population with at least kindergarten education in the United States with a correlation coefficient (R) of 0.345 and weighted average of 98.1%. Similarly, the statistical analysis conducted on geographies consisting of 285,681,276 people shows a mild positive correlation between the proportion of Yugoslavians and percentage of population with at least kindergarten education in the United States with a correlation coefficient (R) of 0.385 and weighted average of 98.2%, a difference of 0.050%.
Kindergarten Correlation Summary
| Measurement | Cambodian | Yugoslavian |
| Minimum | 95.3% | 94.3% |
| Maximum | 100.0% | 100.0% |
| Range | 4.7% | 5.7% |
| Mean | 98.8% | 98.9% |
| Median | 99.0% | 99.0% |
| Interquartile 25% (IQ1) | 98.2% | 98.2% |
| Interquartile 75% (IQ3) | 99.7% | 100.0% |
| Interquartile Range (IQR) | 1.5% | 1.8% |
| Standard Deviation (Sample) | 1.1% | 1.1% |
| Standard Deviation (Population) | 1.1% | 1.1% |
Demographics Similar to Cambodians and Yugoslavians by Kindergarten
In terms of kindergarten, the demographic groups most similar to Cambodians are Seminole (98.1%, a difference of 0.0%), Immigrants from Croatia (98.1%, a difference of 0.0%), Spaniard (98.1%, a difference of 0.0%), Immigrants from Serbia (98.1%, a difference of 0.010%), and Immigrants from Europe (98.1%, a difference of 0.010%). Similarly, the demographic groups most similar to Yugoslavians are Immigrants from France (98.2%, a difference of 0.0%), Iranian (98.2%, a difference of 0.010%), Spanish (98.2%, a difference of 0.010%), Thai (98.2%, a difference of 0.010%), and Ute (98.2%, a difference of 0.020%).
| Demographics | Rating | Rank | Kindergarten |
| Ute | 96.3 /100 | #114 | Exceptional 98.2% |
| Iranians | 96.2 /100 | #115 | Exceptional 98.2% |
| Spanish | 95.8 /100 | #116 | Exceptional 98.2% |
| Immigrants | France | 95.5 /100 | #117 | Exceptional 98.2% |
| Yugoslavians | 95.5 /100 | #118 | Exceptional 98.2% |
| Thais | 94.8 /100 | #119 | Exceptional 98.2% |
| Okinawans | 94.4 /100 | #120 | Exceptional 98.2% |
| Immigrants | Zimbabwe | 94.0 /100 | #121 | Exceptional 98.2% |
| Immigrants | Japan | 94.0 /100 | #122 | Exceptional 98.2% |
| Menominee | 93.9 /100 | #123 | Exceptional 98.2% |
| Syrians | 93.6 /100 | #124 | Exceptional 98.2% |
| Iroquois | 93.5 /100 | #125 | Exceptional 98.2% |
| Lebanese | 93.5 /100 | #126 | Exceptional 98.2% |
| Immigrants | Saudi Arabia | 93.1 /100 | #127 | Exceptional 98.1% |
| Immigrants | Serbia | 92.4 /100 | #128 | Exceptional 98.1% |
| Seminole | 91.5 /100 | #129 | Exceptional 98.1% |
| Immigrants | Croatia | 91.2 /100 | #130 | Exceptional 98.1% |
| Cambodians | 91.2 /100 | #131 | Exceptional 98.1% |
| Spaniards | 91.0 /100 | #132 | Exceptional 98.1% |
| Immigrants | Europe | 90.4 /100 | #133 | Exceptional 98.1% |
| Immigrants | Bulgaria | 89.4 /100 | #134 | Excellent 98.1% |