Osage vs Immigrants from Poland Kindergarten
COMPARE
Osage
Immigrants from Poland
Kindergarten
Kindergarten Comparison
Osage
Immigrants from Poland
98.3%
KINDERGARTEN
99.1/ 100
METRIC RATING
83rd/ 347
METRIC RANK
97.9%
KINDERGARTEN
41.4/ 100
METRIC RATING
183rd/ 347
METRIC RANK
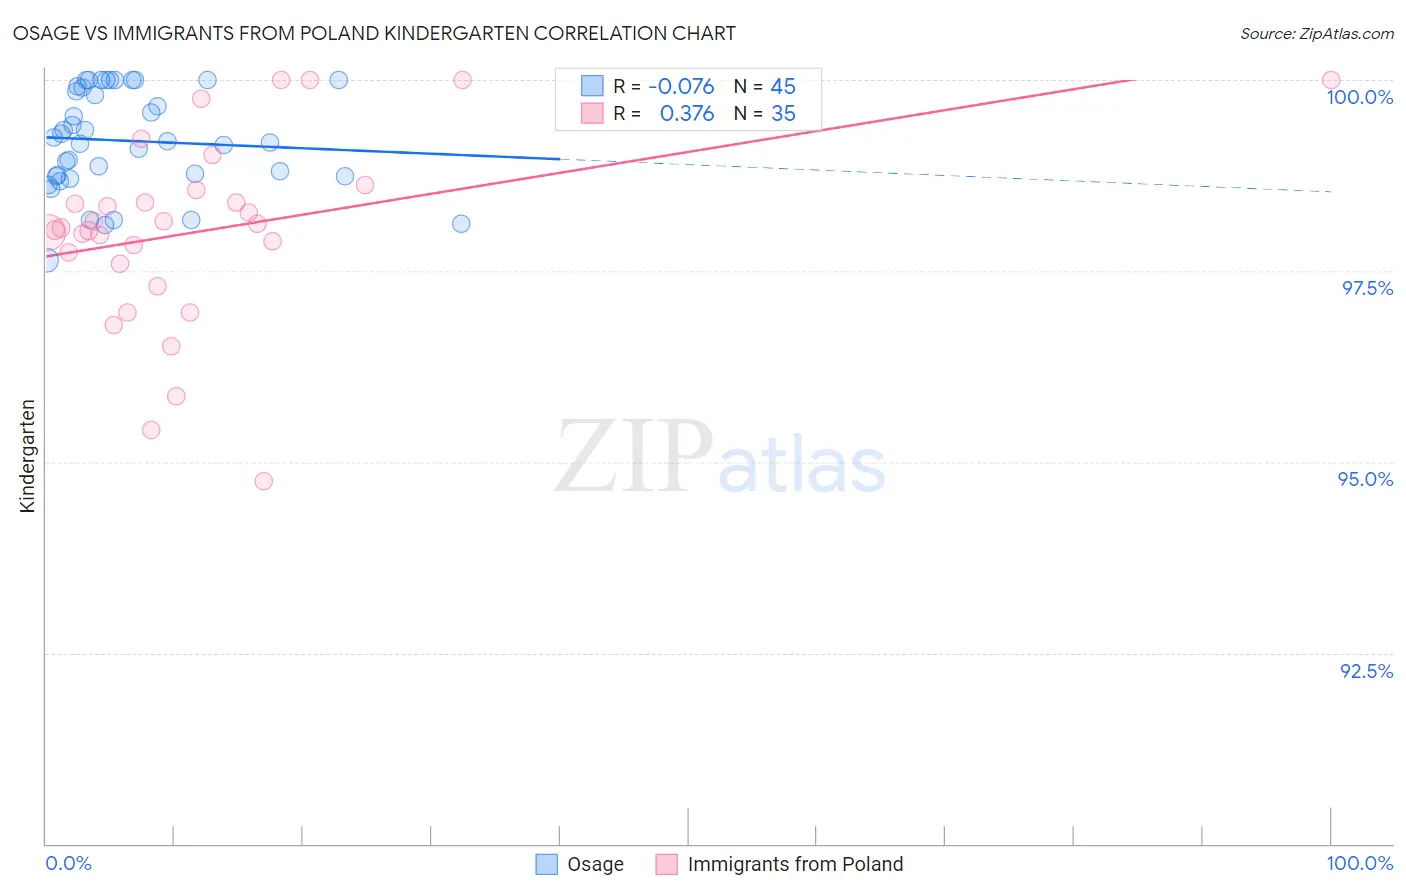
Osage vs Immigrants from Poland Kindergarten Correlation Chart
The statistical analysis conducted on geographies consisting of 91,808,929 people shows a slight negative correlation between the proportion of Osage and percentage of population with at least kindergarten education in the United States with a correlation coefficient (R) of -0.076 and weighted average of 98.3%. Similarly, the statistical analysis conducted on geographies consisting of 304,861,559 people shows a mild positive correlation between the proportion of Immigrants from Poland and percentage of population with at least kindergarten education in the United States with a correlation coefficient (R) of 0.376 and weighted average of 97.9%, a difference of 0.39%.
Kindergarten Correlation Summary
| Measurement | Osage | Immigrants from Poland |
| Minimum | 97.6% | 94.8% |
| Maximum | 100.0% | 100.0% |
| Range | 2.4% | 5.2% |
| Mean | 99.2% | 98.0% |
| Median | 99.2% | 98.1% |
| Interquartile 25% (IQ1) | 98.7% | 97.6% |
| Interquartile 75% (IQ3) | 99.9% | 98.6% |
| Interquartile Range (IQR) | 1.2% | 0.97% |
| Standard Deviation (Sample) | 0.66% | 1.2% |
| Standard Deviation (Population) | 0.65% | 1.2% |
Similar Demographics by Kindergarten
Demographics Similar to Osage by Kindergarten
In terms of kindergarten, the demographic groups most similar to Osage are Icelander (98.3%, a difference of 0.0%), Potawatomi (98.3%, a difference of 0.0%), Immigrants from England (98.3%, a difference of 0.010%), Delaware (98.3%, a difference of 0.010%), and Shoshone (98.3%, a difference of 0.010%).
| Demographics | Rating | Rank | Kindergarten |
| Immigrants | England | 99.3 /100 | #76 | Exceptional 98.3% |
| Delaware | 99.3 /100 | #77 | Exceptional 98.3% |
| Shoshone | 99.2 /100 | #78 | Exceptional 98.3% |
| Immigrants | Belgium | 99.2 /100 | #79 | Exceptional 98.3% |
| Immigrants | Lithuania | 99.2 /100 | #80 | Exceptional 98.3% |
| Icelanders | 99.2 /100 | #81 | Exceptional 98.3% |
| Potawatomi | 99.2 /100 | #82 | Exceptional 98.3% |
| Osage | 99.1 /100 | #83 | Exceptional 98.3% |
| Immigrants | Denmark | 99.1 /100 | #84 | Exceptional 98.3% |
| Immigrants | Sweden | 99.1 /100 | #85 | Exceptional 98.3% |
| Hopi | 99.0 /100 | #86 | Exceptional 98.3% |
| Immigrants | Australia | 99.0 /100 | #87 | Exceptional 98.3% |
| Ukrainians | 98.8 /100 | #88 | Exceptional 98.3% |
| Immigrants | South Africa | 98.8 /100 | #89 | Exceptional 98.3% |
| Zimbabweans | 98.8 /100 | #90 | Exceptional 98.3% |
Demographics Similar to Immigrants from Poland by Kindergarten
In terms of kindergarten, the demographic groups most similar to Immigrants from Poland are Egyptian (97.9%, a difference of 0.0%), Immigrants from Argentina (97.9%, a difference of 0.0%), Portuguese (97.9%, a difference of 0.010%), Immigrants from Belarus (97.9%, a difference of 0.010%), and Albanian (97.9%, a difference of 0.020%).
| Demographics | Rating | Rank | Kindergarten |
| Albanians | 48.5 /100 | #176 | Average 97.9% |
| Immigrants | Venezuela | 47.9 /100 | #177 | Average 97.9% |
| Brazilians | 47.6 /100 | #178 | Average 97.9% |
| Argentineans | 46.8 /100 | #179 | Average 97.9% |
| Immigrants | Bosnia and Herzegovina | 46.7 /100 | #180 | Average 97.9% |
| Portuguese | 43.5 /100 | #181 | Average 97.9% |
| Egyptians | 42.4 /100 | #182 | Average 97.9% |
| Immigrants | Poland | 41.4 /100 | #183 | Average 97.9% |
| Immigrants | Argentina | 40.7 /100 | #184 | Average 97.9% |
| Immigrants | Belarus | 39.4 /100 | #185 | Fair 97.9% |
| Pakistanis | 36.0 /100 | #186 | Fair 97.9% |
| Immigrants | Kazakhstan | 35.9 /100 | #187 | Fair 97.9% |
| Arabs | 35.4 /100 | #188 | Fair 97.9% |
| Paiute | 34.7 /100 | #189 | Fair 97.9% |
| Panamanians | 33.3 /100 | #190 | Fair 97.9% |