Immigrants from Sierra Leone vs Marshallese Bachelor's Degree
COMPARE
Immigrants from Sierra Leone
Marshallese
Bachelor's Degree
Bachelor's Degree Comparison
Immigrants from Sierra Leone
Marshallese
39.0%
BACHELOR'S DEGREE
79.0/ 100
METRIC RATING
147th/ 347
METRIC RANK
31.7%
BACHELOR'S DEGREE
0.1/ 100
METRIC RATING
278th/ 347
METRIC RANK
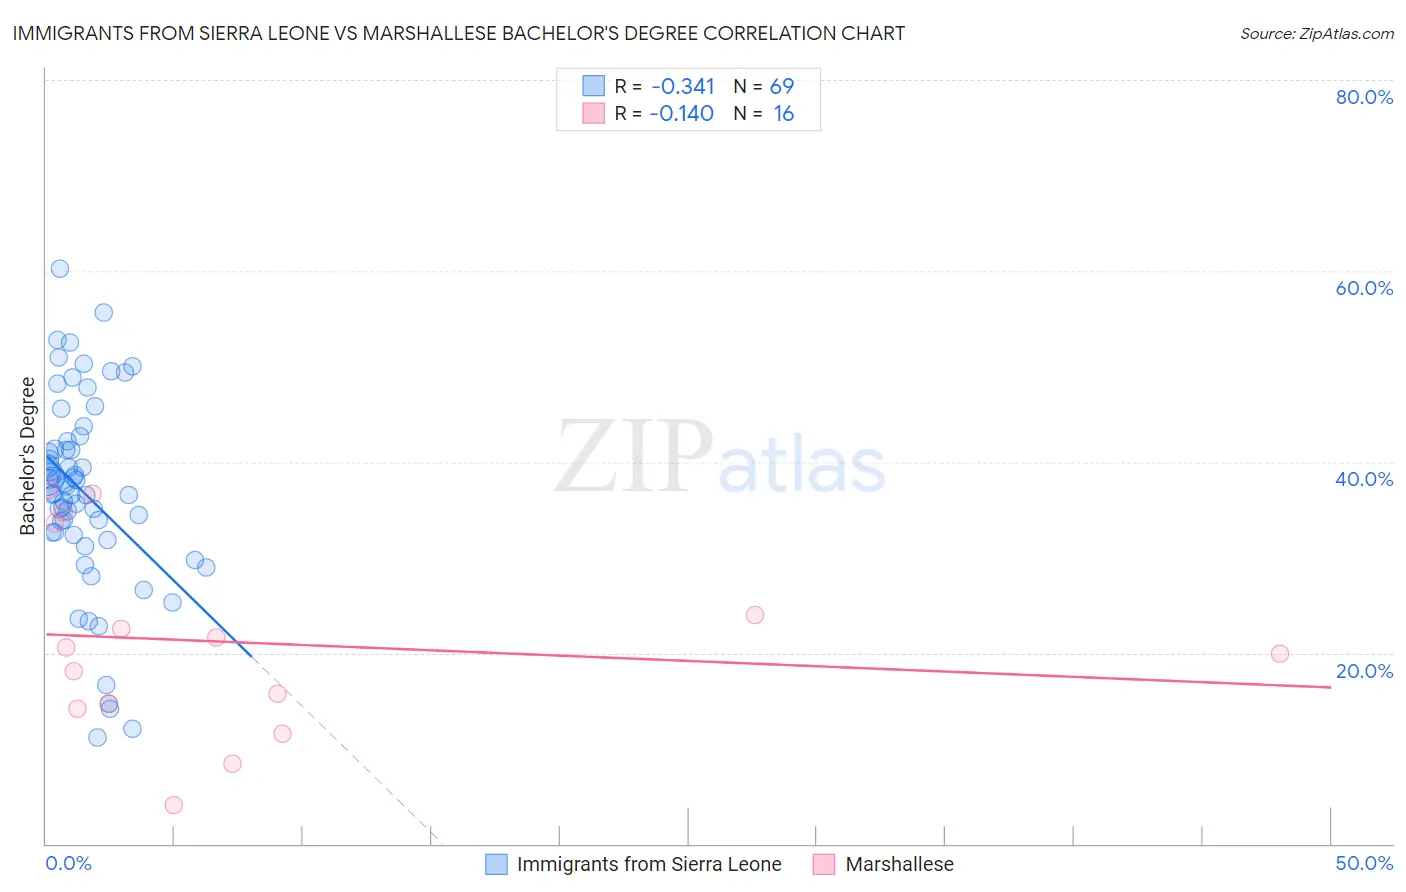
Immigrants from Sierra Leone vs Marshallese Bachelor's Degree Correlation Chart
The statistical analysis conducted on geographies consisting of 101,624,736 people shows a mild negative correlation between the proportion of Immigrants from Sierra Leone and percentage of population with at least bachelor's degree education in the United States with a correlation coefficient (R) of -0.341 and weighted average of 39.0%. Similarly, the statistical analysis conducted on geographies consisting of 14,761,315 people shows a poor negative correlation between the proportion of Marshallese and percentage of population with at least bachelor's degree education in the United States with a correlation coefficient (R) of -0.140 and weighted average of 31.7%, a difference of 23.0%.
Bachelor's Degree Correlation Summary
| Measurement | Immigrants from Sierra Leone | Marshallese |
| Minimum | 11.2% | 4.0% |
| Maximum | 60.2% | 37.2% |
| Range | 49.0% | 33.1% |
| Mean | 36.8% | 21.1% |
| Median | 37.5% | 20.2% |
| Interquartile 25% (IQ1) | 32.5% | 14.4% |
| Interquartile 75% (IQ3) | 41.7% | 28.8% |
| Interquartile Range (IQR) | 9.2% | 14.3% |
| Standard Deviation (Sample) | 10.1% | 10.1% |
| Standard Deviation (Population) | 10.0% | 9.8% |
Similar Demographics by Bachelor's Degree
Demographics Similar to Immigrants from Sierra Leone by Bachelor's Degree
In terms of bachelor's degree, the demographic groups most similar to Immigrants from Sierra Leone are Swedish (39.1%, a difference of 0.030%), Slovene (39.1%, a difference of 0.070%), Immigrants from Afghanistan (39.1%, a difference of 0.10%), Polish (39.1%, a difference of 0.12%), and Iraqi (39.0%, a difference of 0.14%).
| Demographics | Rating | Rank | Bachelor's Degree |
| Immigrants | Armenia | 84.1 /100 | #140 | Excellent 39.4% |
| South American Indians | 83.6 /100 | #141 | Excellent 39.3% |
| Immigrants | North Macedonia | 81.6 /100 | #142 | Excellent 39.2% |
| Poles | 79.8 /100 | #143 | Good 39.1% |
| Immigrants | Afghanistan | 79.7 /100 | #144 | Good 39.1% |
| Slovenes | 79.5 /100 | #145 | Good 39.1% |
| Swedes | 79.2 /100 | #146 | Good 39.1% |
| Immigrants | Sierra Leone | 79.0 /100 | #147 | Good 39.0% |
| Iraqis | 78.1 /100 | #148 | Good 39.0% |
| Immigrants | Poland | 77.5 /100 | #149 | Good 39.0% |
| South Americans | 77.3 /100 | #150 | Good 38.9% |
| Immigrants | Africa | 76.5 /100 | #151 | Good 38.9% |
| Sudanese | 76.4 /100 | #152 | Good 38.9% |
| Slavs | 75.9 /100 | #153 | Good 38.9% |
| Canadians | 75.0 /100 | #154 | Good 38.8% |
Demographics Similar to Marshallese by Bachelor's Degree
In terms of bachelor's degree, the demographic groups most similar to Marshallese are Dominican (31.8%, a difference of 0.050%), Salvadoran (31.8%, a difference of 0.20%), Samoan (31.8%, a difference of 0.24%), Hawaiian (31.6%, a difference of 0.35%), and Potawatomi (31.9%, a difference of 0.37%).
| Demographics | Rating | Rank | Bachelor's Degree |
| Central Americans | 0.2 /100 | #271 | Tragic 31.9% |
| Comanche | 0.2 /100 | #272 | Tragic 31.9% |
| Americans | 0.2 /100 | #273 | Tragic 31.9% |
| Potawatomi | 0.2 /100 | #274 | Tragic 31.9% |
| Samoans | 0.1 /100 | #275 | Tragic 31.8% |
| Salvadorans | 0.1 /100 | #276 | Tragic 31.8% |
| Dominicans | 0.1 /100 | #277 | Tragic 31.8% |
| Marshallese | 0.1 /100 | #278 | Tragic 31.7% |
| Hawaiians | 0.1 /100 | #279 | Tragic 31.6% |
| Immigrants | Laos | 0.1 /100 | #280 | Tragic 31.6% |
| Blackfeet | 0.1 /100 | #281 | Tragic 31.5% |
| Immigrants | Caribbean | 0.1 /100 | #282 | Tragic 31.4% |
| Hondurans | 0.1 /100 | #283 | Tragic 31.3% |
| Haitians | 0.1 /100 | #284 | Tragic 31.3% |
| Aleuts | 0.1 /100 | #285 | Tragic 31.3% |