Eastern European vs Immigrants from Asia 11th Grade
COMPARE
Eastern European
Immigrants from Asia
11th Grade
11th Grade Comparison
Eastern Europeans
Immigrants from Asia
94.6%
11TH GRADE
100.0/ 100
METRIC RATING
14th/ 347
METRIC RANK
92.4%
11TH GRADE
37.4/ 100
METRIC RATING
184th/ 347
METRIC RANK
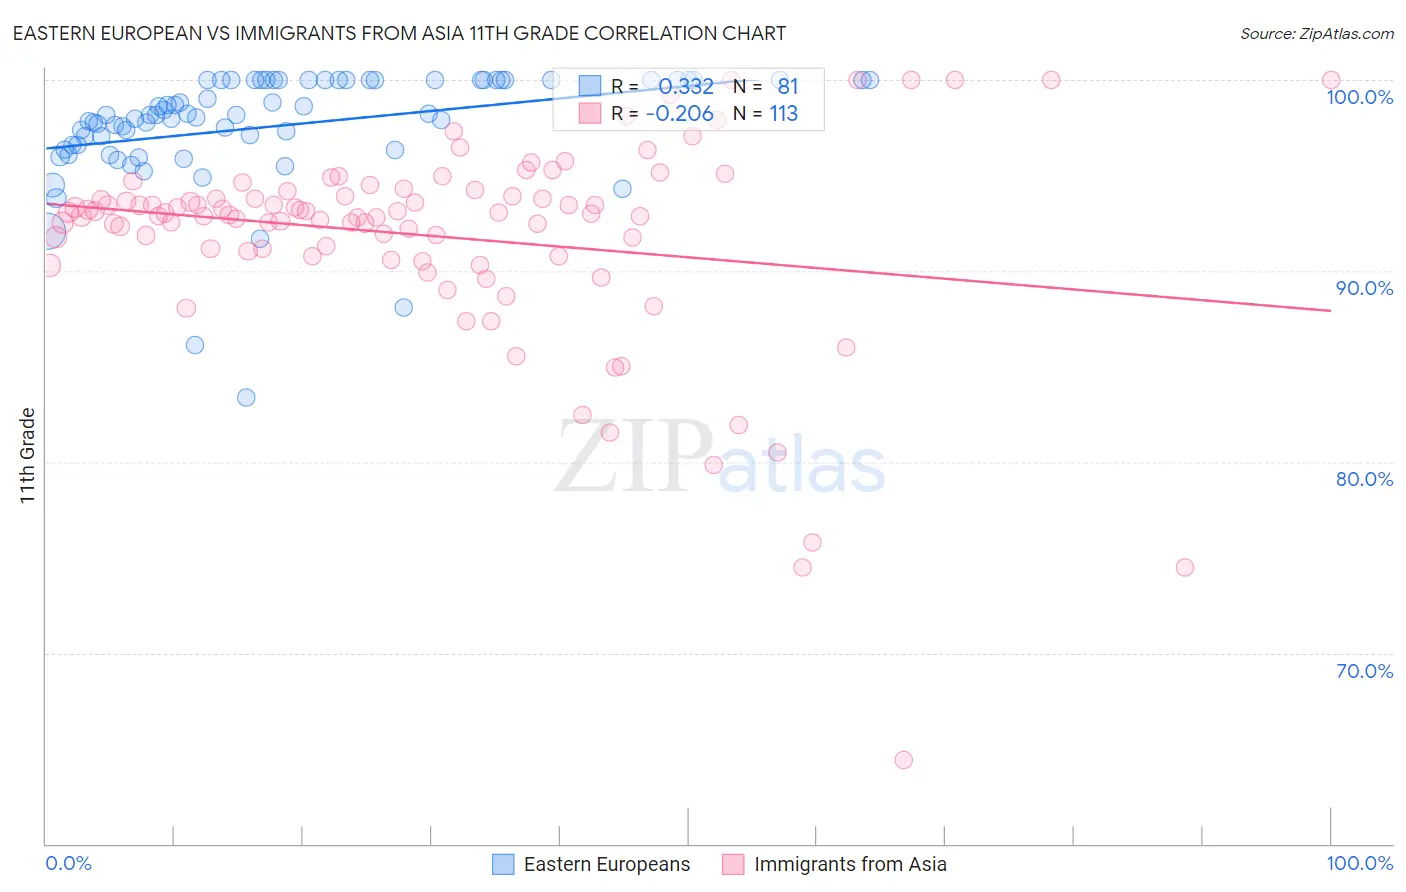
Eastern European vs Immigrants from Asia 11th Grade Correlation Chart
The statistical analysis conducted on geographies consisting of 461,247,615 people shows a mild positive correlation between the proportion of Eastern Europeans and percentage of population with at least 11th grade education in the United States with a correlation coefficient (R) of 0.332 and weighted average of 94.6%. Similarly, the statistical analysis conducted on geographies consisting of 549,170,438 people shows a weak negative correlation between the proportion of Immigrants from Asia and percentage of population with at least 11th grade education in the United States with a correlation coefficient (R) of -0.206 and weighted average of 92.4%, a difference of 2.3%.
11th Grade Correlation Summary
| Measurement | Eastern European | Immigrants from Asia |
| Minimum | 83.3% | 64.4% |
| Maximum | 100.0% | 100.0% |
| Range | 16.7% | 35.6% |
| Mean | 97.6% | 91.8% |
| Median | 98.1% | 93.0% |
| Interquartile 25% (IQ1) | 96.5% | 90.9% |
| Interquartile 75% (IQ3) | 100.0% | 94.1% |
| Interquartile Range (IQR) | 3.5% | 3.1% |
| Standard Deviation (Sample) | 3.0% | 5.4% |
| Standard Deviation (Population) | 3.0% | 5.4% |
Similar Demographics by 11th Grade
Demographics Similar to Eastern Europeans by 11th Grade
In terms of 11th grade, the demographic groups most similar to Eastern Europeans are Chinese (94.6%, a difference of 0.060%), Bulgarian (94.5%, a difference of 0.080%), Immigrants from India (94.5%, a difference of 0.080%), Luxembourger (94.5%, a difference of 0.080%), and Maltese (94.5%, a difference of 0.090%).
| Demographics | Rating | Rank | 11th Grade |
| Poles | 100.0 /100 | #7 | Exceptional 94.8% |
| Croatians | 100.0 /100 | #8 | Exceptional 94.7% |
| Danes | 100.0 /100 | #9 | Exceptional 94.7% |
| Finns | 100.0 /100 | #10 | Exceptional 94.7% |
| Germans | 100.0 /100 | #11 | Exceptional 94.7% |
| Latvians | 100.0 /100 | #12 | Exceptional 94.7% |
| Chinese | 100.0 /100 | #13 | Exceptional 94.6% |
| Eastern Europeans | 100.0 /100 | #14 | Exceptional 94.6% |
| Bulgarians | 100.0 /100 | #15 | Exceptional 94.5% |
| Immigrants | India | 100.0 /100 | #16 | Exceptional 94.5% |
| Luxembourgers | 100.0 /100 | #17 | Exceptional 94.5% |
| Maltese | 100.0 /100 | #18 | Exceptional 94.5% |
| Scandinavians | 100.0 /100 | #19 | Exceptional 94.5% |
| Italians | 100.0 /100 | #20 | Exceptional 94.5% |
| Tlingit-Haida | 100.0 /100 | #21 | Exceptional 94.4% |
Demographics Similar to Immigrants from Asia by 11th Grade
In terms of 11th grade, the demographic groups most similar to Immigrants from Asia are Immigrants from Malaysia (92.4%, a difference of 0.0%), Immigrants from Morocco (92.4%, a difference of 0.010%), Immigrants from Nepal (92.4%, a difference of 0.010%), Arapaho (92.4%, a difference of 0.020%), and Inupiat (92.4%, a difference of 0.030%).
| Demographics | Rating | Rank | 11th Grade |
| Guamanians/Chamorros | 45.0 /100 | #177 | Average 92.5% |
| Sudanese | 43.4 /100 | #178 | Average 92.5% |
| Creek | 40.9 /100 | #179 | Average 92.4% |
| Inupiat | 40.7 /100 | #180 | Average 92.4% |
| Cherokee | 40.7 /100 | #181 | Average 92.4% |
| Immigrants | Morocco | 38.6 /100 | #182 | Fair 92.4% |
| Immigrants | Malaysia | 37.6 /100 | #183 | Fair 92.4% |
| Immigrants | Asia | 37.4 /100 | #184 | Fair 92.4% |
| Immigrants | Nepal | 36.4 /100 | #185 | Fair 92.4% |
| Arapaho | 35.1 /100 | #186 | Fair 92.4% |
| Immigrants | Western Asia | 35.0 /100 | #187 | Fair 92.4% |
| Immigrants | Indonesia | 33.7 /100 | #188 | Fair 92.4% |
| Immigrants | Chile | 33.3 /100 | #189 | Fair 92.4% |
| Chickasaw | 31.4 /100 | #190 | Fair 92.3% |
| French American Indians | 30.8 /100 | #191 | Fair 92.3% |