Norwegian vs Immigrants from Dominican Republic 12th Grade, No Diploma
COMPARE
Norwegian
Immigrants from Dominican Republic
12th Grade, No Diploma
12th Grade, No Diploma Comparison
Norwegians
Immigrants from Dominican Republic
94.0%
12TH GRADE, NO DIPLOMA
100.0/ 100
METRIC RATING
1st/ 347
METRIC RANK
84.9%
12TH GRADE, NO DIPLOMA
0.0/ 100
METRIC RATING
334th/ 347
METRIC RANK
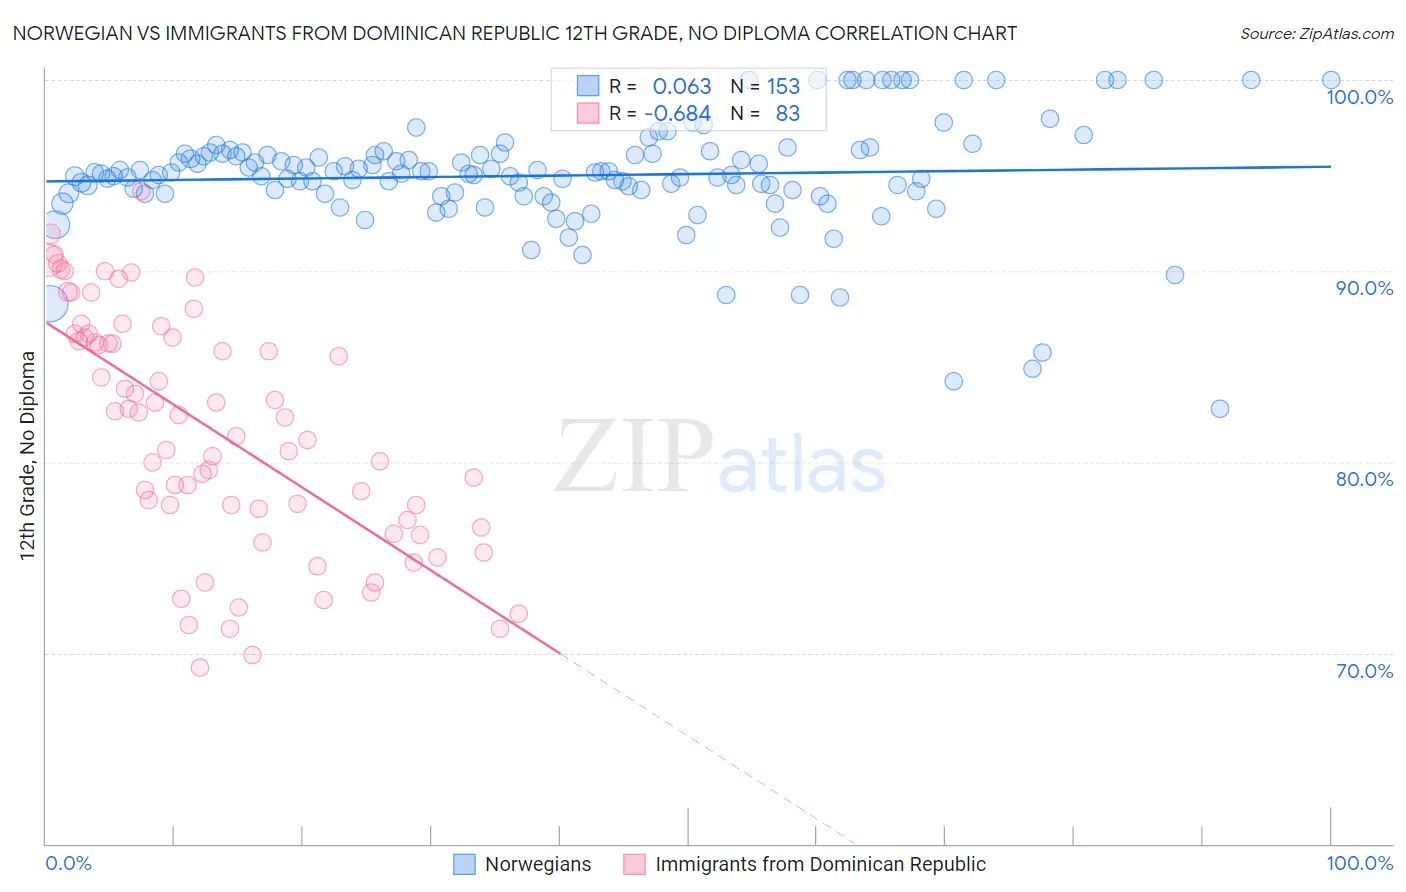
Norwegian vs Immigrants from Dominican Republic 12th Grade, No Diploma Correlation Chart
The statistical analysis conducted on geographies consisting of 533,395,758 people shows a slight positive correlation between the proportion of Norwegians and percentage of population with at least 12th grade (no diploma) education in the United States with a correlation coefficient (R) of 0.063 and weighted average of 94.0%. Similarly, the statistical analysis conducted on geographies consisting of 275,144,349 people shows a significant negative correlation between the proportion of Immigrants from Dominican Republic and percentage of population with at least 12th grade (no diploma) education in the United States with a correlation coefficient (R) of -0.684 and weighted average of 84.9%, a difference of 10.8%.
12th Grade, No Diploma Correlation Summary
| Measurement | Norwegian | Immigrants from Dominican Republic |
| Minimum | 82.8% | 69.2% |
| Maximum | 100.0% | 94.2% |
| Range | 17.2% | 25.0% |
| Mean | 95.0% | 81.6% |
| Median | 95.1% | 82.3% |
| Interquartile 25% (IQ1) | 94.1% | 77.0% |
| Interquartile 75% (IQ3) | 96.1% | 86.5% |
| Interquartile Range (IQR) | 2.1% | 9.5% |
| Standard Deviation (Sample) | 2.9% | 6.2% |
| Standard Deviation (Population) | 2.9% | 6.1% |
Similar Demographics by 12th Grade, No Diploma
Demographics Similar to Norwegians by 12th Grade, No Diploma
In terms of 12th grade, no diploma, the demographic groups most similar to Norwegians are Swedish (93.7%, a difference of 0.30%), Lithuanian (93.6%, a difference of 0.40%), Slovene (93.6%, a difference of 0.41%), Carpatho Rusyn (93.6%, a difference of 0.42%), and Immigrants from India (93.6%, a difference of 0.43%).
| Demographics | Rating | Rank | 12th Grade, No Diploma |
| Norwegians | 100.0 /100 | #1 | Exceptional 94.0% |
| Swedes | 100.0 /100 | #2 | Exceptional 93.7% |
| Lithuanians | 100.0 /100 | #3 | Exceptional 93.6% |
| Slovenes | 100.0 /100 | #4 | Exceptional 93.6% |
| Carpatho Rusyns | 100.0 /100 | #5 | Exceptional 93.6% |
| Immigrants | India | 100.0 /100 | #6 | Exceptional 93.6% |
| Slovaks | 100.0 /100 | #7 | Exceptional 93.6% |
| Chinese | 100.0 /100 | #8 | Exceptional 93.6% |
| Latvians | 100.0 /100 | #9 | Exceptional 93.6% |
| Croatians | 100.0 /100 | #10 | Exceptional 93.5% |
| Poles | 100.0 /100 | #11 | Exceptional 93.5% |
| Eastern Europeans | 100.0 /100 | #12 | Exceptional 93.5% |
| Danes | 100.0 /100 | #13 | Exceptional 93.5% |
| Bulgarians | 100.0 /100 | #14 | Exceptional 93.5% |
| Finns | 100.0 /100 | #15 | Exceptional 93.4% |
Demographics Similar to Immigrants from Dominican Republic by 12th Grade, No Diploma
In terms of 12th grade, no diploma, the demographic groups most similar to Immigrants from Dominican Republic are Immigrants from Yemen (84.8%, a difference of 0.040%), Immigrants from Latin America (85.0%, a difference of 0.14%), Tohono O'odham (84.7%, a difference of 0.18%), Immigrants from Honduras (85.0%, a difference of 0.21%), and Pima (84.6%, a difference of 0.32%).
| Demographics | Rating | Rank | 12th Grade, No Diploma |
| Lumbee | 0.0 /100 | #327 | Tragic 85.7% |
| Hondurans | 0.0 /100 | #328 | Tragic 85.5% |
| Hispanics or Latinos | 0.0 /100 | #329 | Tragic 85.4% |
| Immigrants | Azores | 0.0 /100 | #330 | Tragic 85.3% |
| Central Americans | 0.0 /100 | #331 | Tragic 85.2% |
| Immigrants | Honduras | 0.0 /100 | #332 | Tragic 85.0% |
| Immigrants | Latin America | 0.0 /100 | #333 | Tragic 85.0% |
| Immigrants | Dominican Republic | 0.0 /100 | #334 | Tragic 84.9% |
| Immigrants | Yemen | 0.0 /100 | #335 | Tragic 84.8% |
| Tohono O'odham | 0.0 /100 | #336 | Tragic 84.7% |
| Pima | 0.0 /100 | #337 | Tragic 84.6% |
| Guatemalans | 0.0 /100 | #338 | Tragic 84.6% |
| Salvadorans | 0.0 /100 | #339 | Tragic 84.5% |
| Mexicans | 0.0 /100 | #340 | Tragic 84.1% |
| Immigrants | Guatemala | 0.0 /100 | #341 | Tragic 84.0% |