Blackfeet vs European High School Diploma
COMPARE
Blackfeet
European
High School Diploma
High School Diploma Comparison
Blackfeet
Europeans
88.1%
HIGH SCHOOL DIPLOMA
4.2/ 100
METRIC RATING
230th/ 347
METRIC RANK
91.4%
HIGH SCHOOL DIPLOMA
99.9/ 100
METRIC RATING
29th/ 347
METRIC RANK
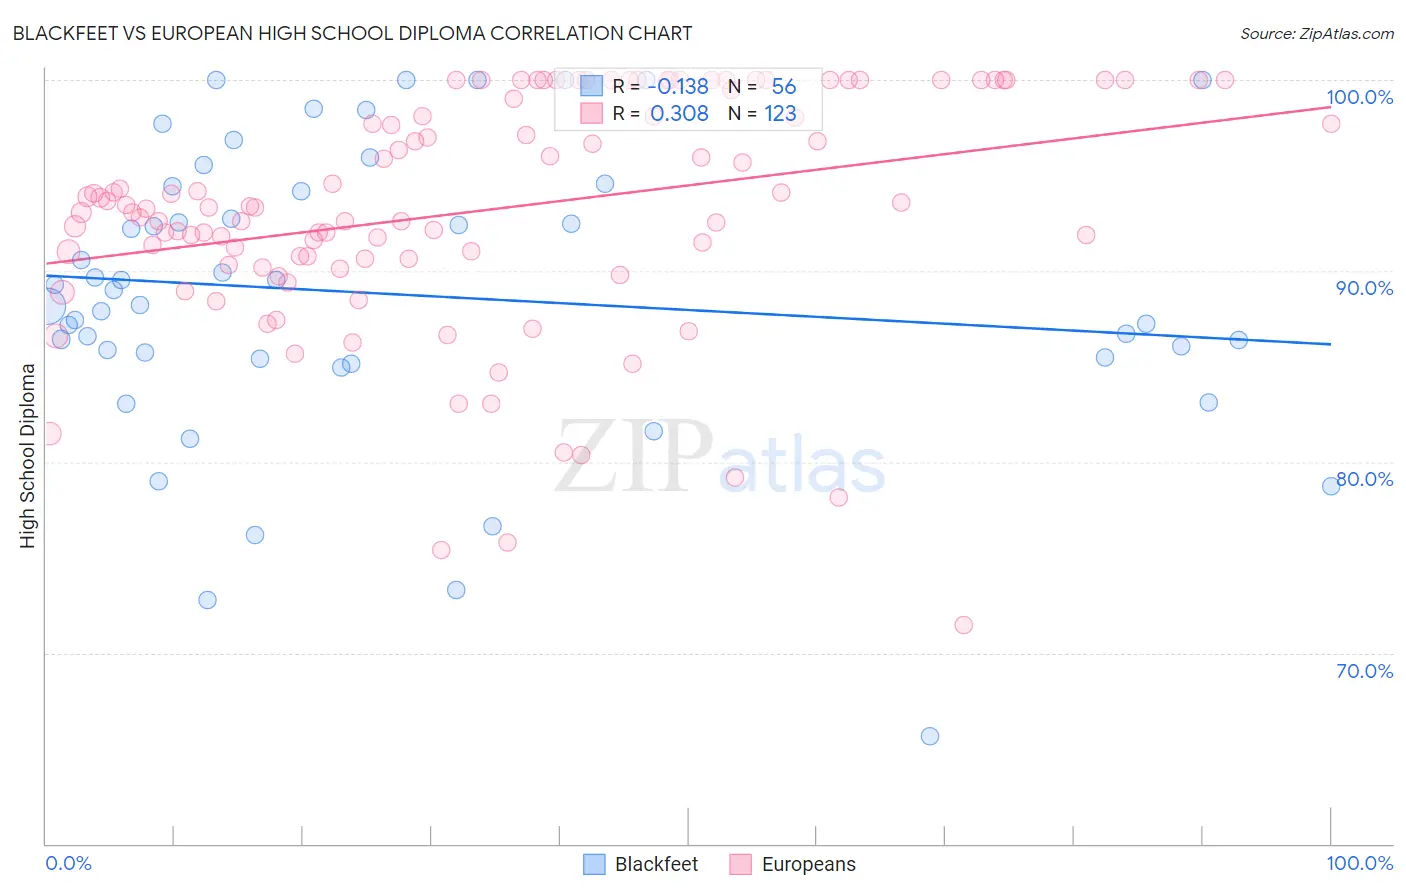
Blackfeet vs European High School Diploma Correlation Chart
The statistical analysis conducted on geographies consisting of 309,582,193 people shows a poor negative correlation between the proportion of Blackfeet and percentage of population with at least high school diploma education in the United States with a correlation coefficient (R) of -0.138 and weighted average of 88.1%. Similarly, the statistical analysis conducted on geographies consisting of 561,829,322 people shows a mild positive correlation between the proportion of Europeans and percentage of population with at least high school diploma education in the United States with a correlation coefficient (R) of 0.308 and weighted average of 91.4%, a difference of 3.8%.
High School Diploma Correlation Summary
| Measurement | Blackfeet | European |
| Minimum | 65.6% | 71.4% |
| Maximum | 100.0% | 100.0% |
| Range | 34.4% | 28.6% |
| Mean | 88.8% | 93.2% |
| Median | 88.6% | 93.3% |
| Interquartile 25% (IQ1) | 85.4% | 90.6% |
| Interquartile 75% (IQ3) | 94.3% | 99.5% |
| Interquartile Range (IQR) | 8.9% | 8.9% |
| Standard Deviation (Sample) | 7.6% | 6.1% |
| Standard Deviation (Population) | 7.5% | 6.1% |
Similar Demographics by High School Diploma
Demographics Similar to Blackfeet by High School Diploma
In terms of high school diploma, the demographic groups most similar to Blackfeet are Colombian (88.1%, a difference of 0.040%), Nigerian (88.2%, a difference of 0.080%), Kiowa (88.2%, a difference of 0.090%), Immigrants from Middle Africa (88.0%, a difference of 0.090%), and Immigrants from Liberia (88.2%, a difference of 0.10%).
| Demographics | Rating | Rank | High School Diploma |
| Immigrants | Zaire | 7.6 /100 | #223 | Tragic 88.3% |
| Shoshone | 7.0 /100 | #224 | Tragic 88.3% |
| Creek | 6.9 /100 | #225 | Tragic 88.3% |
| Uruguayans | 5.6 /100 | #226 | Tragic 88.2% |
| Immigrants | Liberia | 5.5 /100 | #227 | Tragic 88.2% |
| Kiowa | 5.3 /100 | #228 | Tragic 88.2% |
| Nigerians | 5.2 /100 | #229 | Tragic 88.2% |
| Blackfeet | 4.2 /100 | #230 | Tragic 88.1% |
| Colombians | 3.8 /100 | #231 | Tragic 88.1% |
| Immigrants | Middle Africa | 3.4 /100 | #232 | Tragic 88.0% |
| Immigrants | Panama | 3.1 /100 | #233 | Tragic 88.0% |
| Immigrants | Thailand | 3.1 /100 | #234 | Tragic 88.0% |
| Immigrants | Bahamas | 2.9 /100 | #235 | Tragic 88.0% |
| Sub-Saharan Africans | 2.8 /100 | #236 | Tragic 87.9% |
| Taiwanese | 2.8 /100 | #237 | Tragic 87.9% |
Demographics Similar to Europeans by High School Diploma
In terms of high school diploma, the demographic groups most similar to Europeans are Iranian (91.4%, a difference of 0.010%), Immigrants from Northern Europe (91.4%, a difference of 0.010%), Tlingit-Haida (91.4%, a difference of 0.020%), English (91.4%, a difference of 0.020%), and Okinawan (91.4%, a difference of 0.020%).
| Demographics | Rating | Rank | High School Diploma |
| Estonians | 99.9 /100 | #22 | Exceptional 91.6% |
| Scandinavians | 99.9 /100 | #23 | Exceptional 91.5% |
| Italians | 99.9 /100 | #24 | Exceptional 91.5% |
| Thais | 99.9 /100 | #25 | Exceptional 91.5% |
| Russians | 99.9 /100 | #26 | Exceptional 91.5% |
| Cypriots | 99.9 /100 | #27 | Exceptional 91.5% |
| Tlingit-Haida | 99.9 /100 | #28 | Exceptional 91.4% |
| Europeans | 99.9 /100 | #29 | Exceptional 91.4% |
| Iranians | 99.9 /100 | #30 | Exceptional 91.4% |
| Immigrants | Northern Europe | 99.9 /100 | #31 | Exceptional 91.4% |
| English | 99.9 /100 | #32 | Exceptional 91.4% |
| Okinawans | 99.9 /100 | #33 | Exceptional 91.4% |
| Scottish | 99.9 /100 | #34 | Exceptional 91.4% |
| Irish | 99.9 /100 | #35 | Exceptional 91.4% |
| Tsimshian | 99.9 /100 | #36 | Exceptional 91.3% |