Norwegian vs Bangladeshi Unemployment Among Ages 55 to 59 years
COMPARE
Norwegian
Bangladeshi
Unemployment Among Ages 55 to 59 years
Unemployment Among Ages 55 to 59 years Comparison
Norwegians
Bangladeshis
4.2%
UNEMPLOYMENT AMONG AGES 55 TO 59 YEARS
100.0/ 100
METRIC RATING
6th/ 347
METRIC RANK
4.7%
UNEMPLOYMENT AMONG AGES 55 TO 59 YEARS
91.3/ 100
METRIC RATING
114th/ 347
METRIC RANK
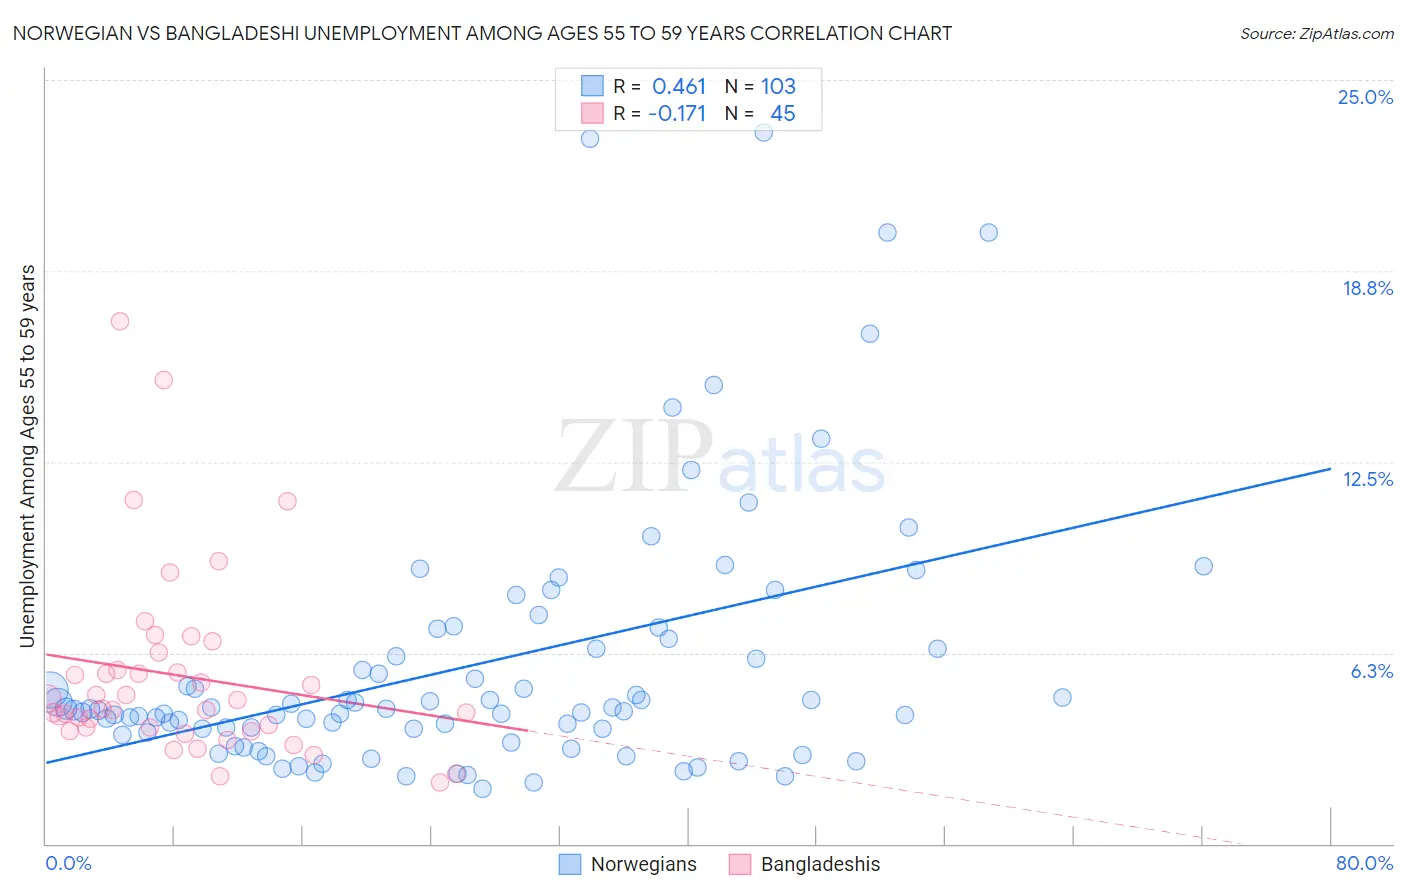
Norwegian vs Bangladeshi Unemployment Among Ages 55 to 59 years Correlation Chart
The statistical analysis conducted on geographies consisting of 463,929,347 people shows a moderate positive correlation between the proportion of Norwegians and unemployment rate among population between the ages 55 and 59 in the United States with a correlation coefficient (R) of 0.461 and weighted average of 4.2%. Similarly, the statistical analysis conducted on geographies consisting of 136,625,211 people shows a poor negative correlation between the proportion of Bangladeshis and unemployment rate among population between the ages 55 and 59 in the United States with a correlation coefficient (R) of -0.171 and weighted average of 4.7%, a difference of 11.8%.
Unemployment Among Ages 55 to 59 years Correlation Summary
| Measurement | Norwegian | Bangladeshi |
| Minimum | 1.8% | 2.0% |
| Maximum | 23.3% | 17.1% |
| Range | 21.5% | 15.1% |
| Mean | 5.8% | 5.5% |
| Median | 4.4% | 4.4% |
| Interquartile 25% (IQ1) | 3.6% | 3.8% |
| Interquartile 75% (IQ3) | 6.4% | 6.0% |
| Interquartile Range (IQR) | 2.7% | 2.2% |
| Standard Deviation (Sample) | 4.3% | 3.1% |
| Standard Deviation (Population) | 4.3% | 3.1% |
Similar Demographics by Unemployment Among Ages 55 to 59 years
Demographics Similar to Norwegians by Unemployment Among Ages 55 to 59 years
In terms of unemployment among ages 55 to 59 years, the demographic groups most similar to Norwegians are Zimbabwean (4.2%, a difference of 0.57%), Immigrants from Bolivia (4.2%, a difference of 0.58%), Bolivian (4.2%, a difference of 0.68%), Cuban (4.2%, a difference of 0.80%), and Venezuelan (4.2%, a difference of 1.1%).
| Demographics | Rating | Rank | Unemployment Among Ages 55 to 59 years |
| Fijians | 100.0 /100 | #1 | Exceptional 4.1% |
| Immigrants | Cuba | 100.0 /100 | #2 | Exceptional 4.1% |
| Immigrants | Venezuela | 100.0 /100 | #3 | Exceptional 4.1% |
| Venezuelans | 100.0 /100 | #4 | Exceptional 4.2% |
| Immigrants | Bolivia | 100.0 /100 | #5 | Exceptional 4.2% |
| Norwegians | 100.0 /100 | #6 | Exceptional 4.2% |
| Zimbabweans | 100.0 /100 | #7 | Exceptional 4.2% |
| Bolivians | 100.0 /100 | #8 | Exceptional 4.2% |
| Cubans | 100.0 /100 | #9 | Exceptional 4.2% |
| Tongans | 100.0 /100 | #10 | Exceptional 4.3% |
| Immigrants | Congo | 100.0 /100 | #11 | Exceptional 4.3% |
| Danes | 100.0 /100 | #12 | Exceptional 4.3% |
| Indonesians | 100.0 /100 | #13 | Exceptional 4.3% |
| Immigrants | India | 100.0 /100 | #14 | Exceptional 4.3% |
| Bulgarians | 100.0 /100 | #15 | Exceptional 4.3% |
Demographics Similar to Bangladeshis by Unemployment Among Ages 55 to 59 years
In terms of unemployment among ages 55 to 59 years, the demographic groups most similar to Bangladeshis are Immigrants from Spain (4.7%, a difference of 0.010%), South American Indian (4.7%, a difference of 0.060%), Turkish (4.7%, a difference of 0.060%), Asian (4.7%, a difference of 0.070%), and Immigrants from Chile (4.7%, a difference of 0.080%).
| Demographics | Rating | Rank | Unemployment Among Ages 55 to 59 years |
| Immigrants | Egypt | 93.5 /100 | #107 | Exceptional 4.7% |
| French | 93.3 /100 | #108 | Exceptional 4.7% |
| Chileans | 93.2 /100 | #109 | Exceptional 4.7% |
| Egyptians | 92.9 /100 | #110 | Exceptional 4.7% |
| Austrians | 92.4 /100 | #111 | Exceptional 4.7% |
| Afghans | 92.1 /100 | #112 | Exceptional 4.7% |
| Immigrants | Spain | 91.4 /100 | #113 | Exceptional 4.7% |
| Bangladeshis | 91.3 /100 | #114 | Exceptional 4.7% |
| South American Indians | 90.9 /100 | #115 | Exceptional 4.7% |
| Turks | 90.9 /100 | #116 | Exceptional 4.7% |
| Asians | 90.8 /100 | #117 | Exceptional 4.7% |
| Immigrants | Chile | 90.7 /100 | #118 | Exceptional 4.7% |
| Whites/Caucasians | 90.7 /100 | #119 | Exceptional 4.7% |
| Immigrants | South Africa | 89.9 /100 | #120 | Excellent 4.7% |
| Pakistanis | 89.7 /100 | #121 | Excellent 4.7% |