Norwegian vs Immigrants from Brazil 11th Grade
COMPARE
Norwegian
Immigrants from Brazil
11th Grade
11th Grade Comparison
Norwegians
Immigrants from Brazil
95.2%
11TH GRADE
100.0/ 100
METRIC RATING
1st/ 347
METRIC RANK
92.9%
11TH GRADE
85.1/ 100
METRIC RATING
138th/ 347
METRIC RANK
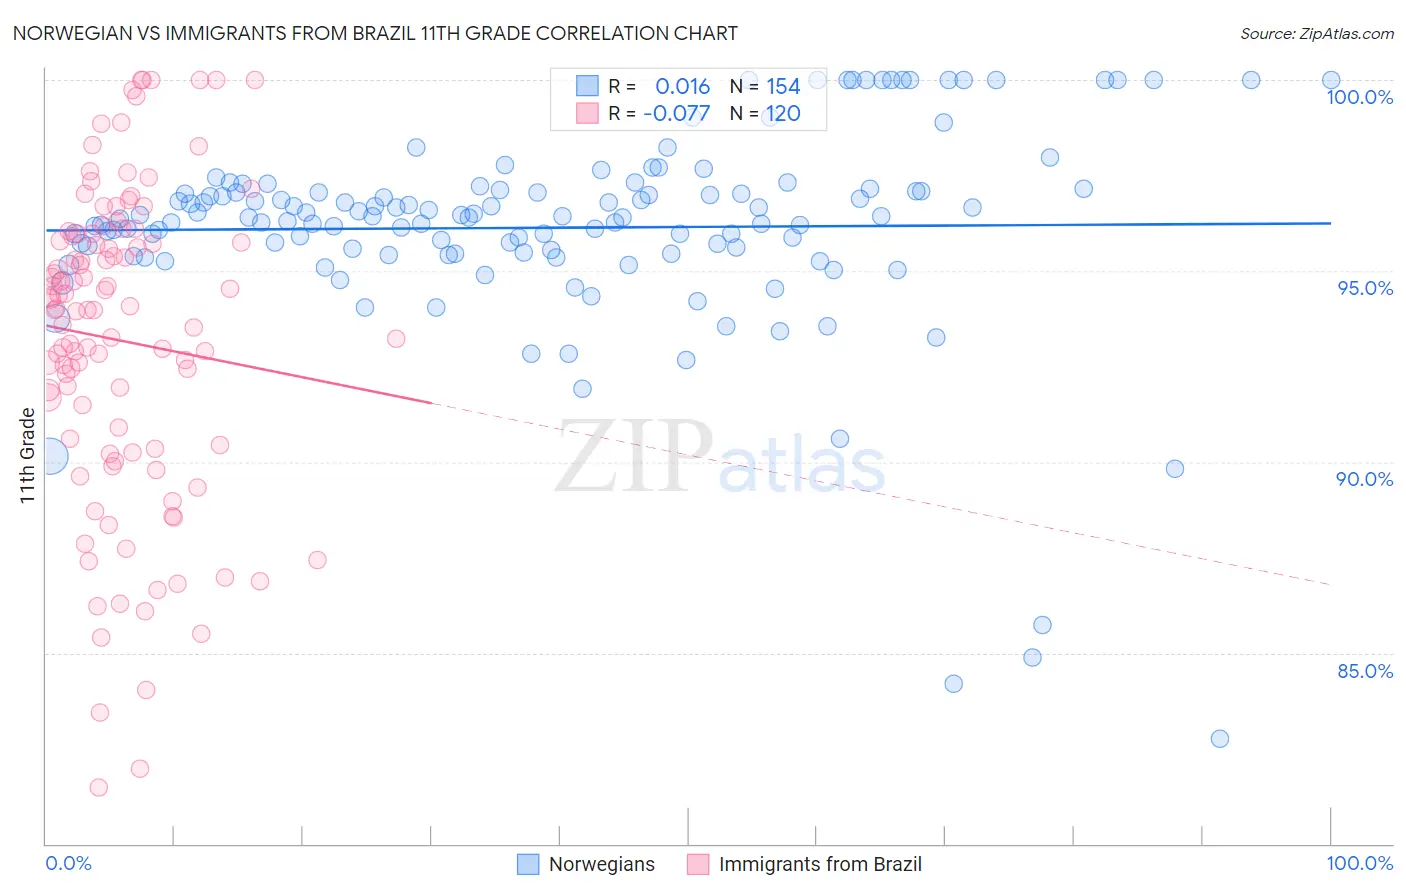
Norwegian vs Immigrants from Brazil 11th Grade Correlation Chart
The statistical analysis conducted on geographies consisting of 533,395,805 people shows no correlation between the proportion of Norwegians and percentage of population with at least 11th grade education in the United States with a correlation coefficient (R) of 0.016 and weighted average of 95.2%. Similarly, the statistical analysis conducted on geographies consisting of 342,965,001 people shows a slight negative correlation between the proportion of Immigrants from Brazil and percentage of population with at least 11th grade education in the United States with a correlation coefficient (R) of -0.077 and weighted average of 92.9%, a difference of 2.5%.
11th Grade Correlation Summary
| Measurement | Norwegian | Immigrants from Brazil |
| Minimum | 82.8% | 81.5% |
| Maximum | 100.0% | 100.0% |
| Range | 17.2% | 18.5% |
| Mean | 96.1% | 93.2% |
| Median | 96.4% | 94.0% |
| Interquartile 25% (IQ1) | 95.5% | 90.4% |
| Interquartile 75% (IQ3) | 97.1% | 95.9% |
| Interquartile Range (IQR) | 1.6% | 5.5% |
| Standard Deviation (Sample) | 2.7% | 4.1% |
| Standard Deviation (Population) | 2.7% | 4.1% |
Similar Demographics by 11th Grade
Demographics Similar to Norwegians by 11th Grade
In terms of 11th grade, the demographic groups most similar to Norwegians are Swedish (94.9%, a difference of 0.28%), Slovene (94.9%, a difference of 0.30%), Slovak (94.9%, a difference of 0.32%), Carpatho Rusyn (94.8%, a difference of 0.38%), and Lithuanian (94.8%, a difference of 0.43%).
| Demographics | Rating | Rank | 11th Grade |
| Norwegians | 100.0 /100 | #1 | Exceptional 95.2% |
| Swedes | 100.0 /100 | #2 | Exceptional 94.9% |
| Slovenes | 100.0 /100 | #3 | Exceptional 94.9% |
| Slovaks | 100.0 /100 | #4 | Exceptional 94.9% |
| Carpatho Rusyns | 100.0 /100 | #5 | Exceptional 94.8% |
| Lithuanians | 100.0 /100 | #6 | Exceptional 94.8% |
| Poles | 100.0 /100 | #7 | Exceptional 94.8% |
| Croatians | 100.0 /100 | #8 | Exceptional 94.7% |
| Danes | 100.0 /100 | #9 | Exceptional 94.7% |
| Finns | 100.0 /100 | #10 | Exceptional 94.7% |
| Germans | 100.0 /100 | #11 | Exceptional 94.7% |
| Latvians | 100.0 /100 | #12 | Exceptional 94.7% |
| Chinese | 100.0 /100 | #13 | Exceptional 94.6% |
| Eastern Europeans | 100.0 /100 | #14 | Exceptional 94.6% |
| Bulgarians | 100.0 /100 | #15 | Exceptional 94.5% |
Demographics Similar to Immigrants from Brazil by 11th Grade
In terms of 11th grade, the demographic groups most similar to Immigrants from Brazil are Arab (92.9%, a difference of 0.010%), Cree (92.9%, a difference of 0.020%), Crow (92.9%, a difference of 0.020%), Immigrants from Italy (92.9%, a difference of 0.030%), and Venezuelan (92.9%, a difference of 0.030%).
| Demographics | Rating | Rank | 11th Grade |
| Egyptians | 89.5 /100 | #131 | Excellent 93.0% |
| Immigrants | Bosnia and Herzegovina | 89.0 /100 | #132 | Excellent 93.0% |
| Mongolians | 87.6 /100 | #133 | Excellent 93.0% |
| Delaware | 87.3 /100 | #134 | Excellent 93.0% |
| Immigrants | Italy | 86.6 /100 | #135 | Excellent 92.9% |
| Cree | 85.9 /100 | #136 | Excellent 92.9% |
| Arabs | 85.4 /100 | #137 | Excellent 92.9% |
| Immigrants | Brazil | 85.1 /100 | #138 | Excellent 92.9% |
| Crow | 84.1 /100 | #139 | Excellent 92.9% |
| Venezuelans | 83.4 /100 | #140 | Excellent 92.9% |
| Chileans | 83.0 /100 | #141 | Excellent 92.9% |
| Kenyans | 82.0 /100 | #142 | Excellent 92.9% |
| Ugandans | 81.4 /100 | #143 | Excellent 92.9% |
| Assyrians/Chaldeans/Syriacs | 80.5 /100 | #144 | Excellent 92.8% |
| Pakistanis | 79.6 /100 | #145 | Good 92.8% |