Northern European vs Immigrants from Saudi Arabia Unemployment Among Seniors over 75 years
COMPARE
Northern European
Immigrants from Saudi Arabia
Unemployment Among Seniors over 75 years
Unemployment Among Seniors over 75 years Comparison
Northern Europeans
Immigrants from Saudi Arabia
9.1%
UNEMPLOYMENT AMONG SENIORS OVER 75 YEARS
4.9/ 100
METRIC RATING
230th/ 347
METRIC RANK
9.2%
UNEMPLOYMENT AMONG SENIORS OVER 75 YEARS
2.2/ 100
METRIC RATING
249th/ 347
METRIC RANK
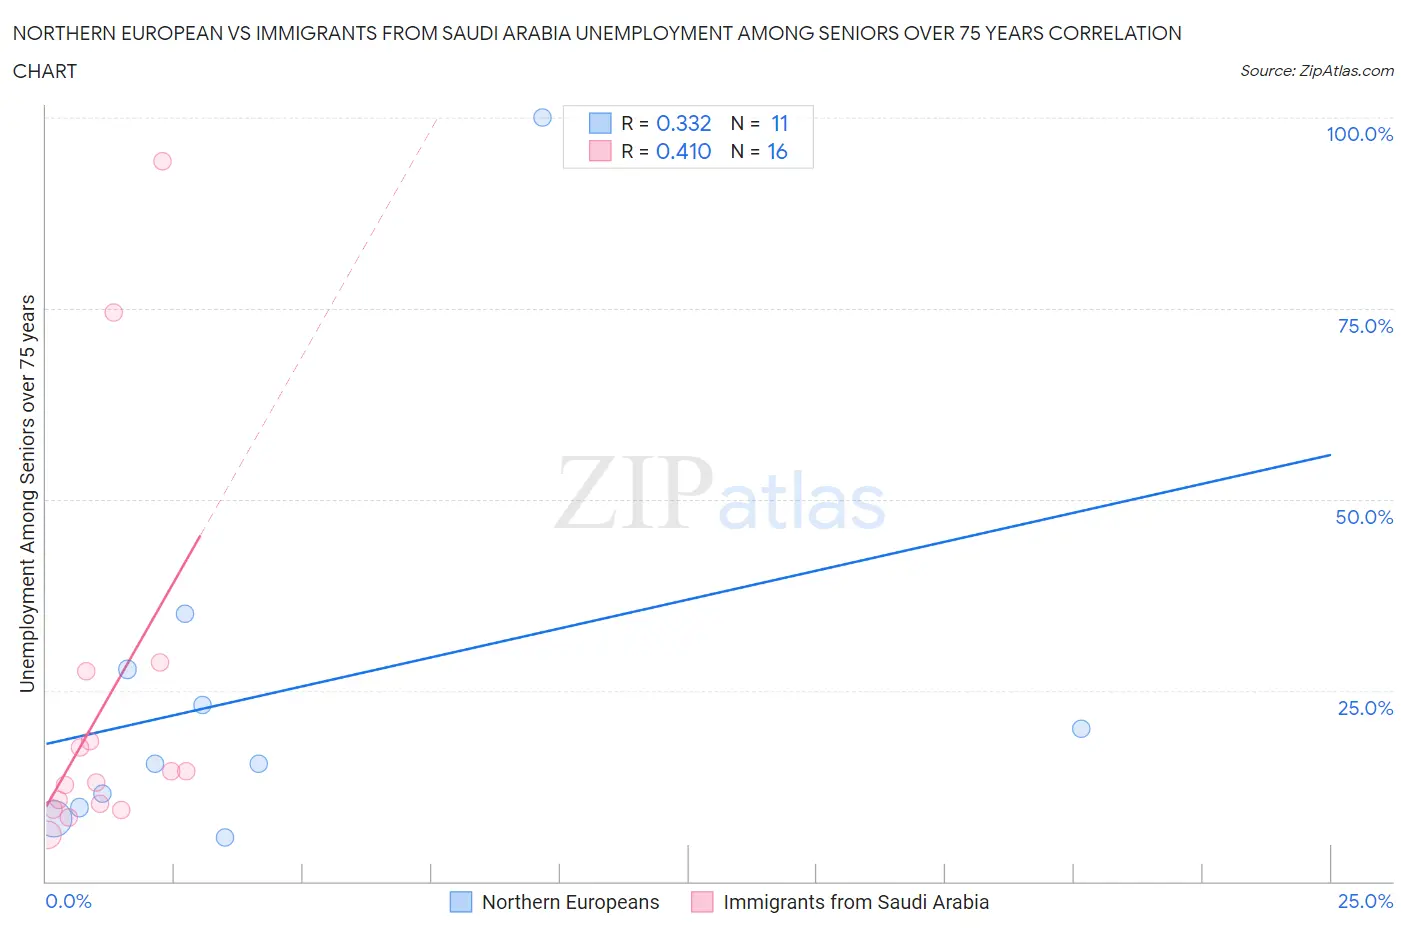
Northern European vs Immigrants from Saudi Arabia Unemployment Among Seniors over 75 years Correlation Chart
The statistical analysis conducted on geographies consisting of 199,397,267 people shows a mild positive correlation between the proportion of Northern Europeans and unemployment rate among seniors over the age of 75 in the United States with a correlation coefficient (R) of 0.332 and weighted average of 9.1%. Similarly, the statistical analysis conducted on geographies consisting of 112,716,416 people shows a moderate positive correlation between the proportion of Immigrants from Saudi Arabia and unemployment rate among seniors over the age of 75 in the United States with a correlation coefficient (R) of 0.410 and weighted average of 9.2%, a difference of 1.1%.
Unemployment Among Seniors over 75 years Correlation Summary
| Measurement | Northern European | Immigrants from Saudi Arabia |
| Minimum | 5.7% | 6.1% |
| Maximum | 100.0% | 94.3% |
| Range | 94.3% | 88.2% |
| Mean | 24.7% | 23.0% |
| Median | 15.4% | 13.6% |
| Interquartile 25% (IQ1) | 9.6% | 9.8% |
| Interquartile 75% (IQ3) | 27.7% | 22.9% |
| Interquartile Range (IQR) | 18.1% | 13.1% |
| Standard Deviation (Sample) | 26.5% | 25.0% |
| Standard Deviation (Population) | 25.3% | 24.2% |
Demographics Similar to Northern Europeans and Immigrants from Saudi Arabia by Unemployment Among Seniors over 75 years
In terms of unemployment among seniors over 75 years, the demographic groups most similar to Northern Europeans are Immigrants from Central America (9.1%, a difference of 0.0%), Hispanic or Latino (9.1%, a difference of 0.010%), African (9.1%, a difference of 0.020%), Yugoslavian (9.1%, a difference of 0.040%), and Vietnamese (9.1%, a difference of 0.090%). Similarly, the demographic groups most similar to Immigrants from Saudi Arabia are Blackfeet (9.2%, a difference of 0.050%), Subsaharan African (9.2%, a difference of 0.090%), Immigrants from North America (9.2%, a difference of 0.11%), Immigrants from Canada (9.2%, a difference of 0.23%), and Immigrants from Germany (9.2%, a difference of 0.29%).
| Demographics | Rating | Rank | Unemployment Among Seniors over 75 years |
| Hispanics or Latinos | 5.0 /100 | #229 | Tragic 9.1% |
| Northern Europeans | 4.9 /100 | #230 | Tragic 9.1% |
| Immigrants | Central America | 4.9 /100 | #231 | Tragic 9.1% |
| Africans | 4.9 /100 | #232 | Tragic 9.1% |
| Yugoslavians | 4.8 /100 | #233 | Tragic 9.1% |
| Vietnamese | 4.6 /100 | #234 | Tragic 9.1% |
| Panamanians | 4.0 /100 | #235 | Tragic 9.1% |
| Jordanians | 4.0 /100 | #236 | Tragic 9.1% |
| Houma | 3.9 /100 | #237 | Tragic 9.1% |
| Inupiat | 3.6 /100 | #238 | Tragic 9.1% |
| Mexicans | 3.5 /100 | #239 | Tragic 9.1% |
| Spanish | 3.3 /100 | #240 | Tragic 9.1% |
| Immigrants | Southern Europe | 2.8 /100 | #241 | Tragic 9.2% |
| Sierra Leoneans | 2.8 /100 | #242 | Tragic 9.2% |
| Slavs | 2.8 /100 | #243 | Tragic 9.2% |
| Immigrants | Germany | 2.7 /100 | #244 | Tragic 9.2% |
| Immigrants | Canada | 2.6 /100 | #245 | Tragic 9.2% |
| Immigrants | North America | 2.4 /100 | #246 | Tragic 9.2% |
| Sub-Saharan Africans | 2.3 /100 | #247 | Tragic 9.2% |
| Blackfeet | 2.3 /100 | #248 | Tragic 9.2% |
| Immigrants | Saudi Arabia | 2.2 /100 | #249 | Tragic 9.2% |