Nonimmigrants vs Mongolian 9th Grade
COMPARE
Nonimmigrants
Mongolian
9th Grade
9th Grade Comparison
Nonimmigrants
Mongolians
95.3%
9TH GRADE
92.0/ 100
METRIC RATING
132nd/ 347
METRIC RANK
95.0%
9TH GRADE
73.0/ 100
METRIC RATING
157th/ 347
METRIC RANK
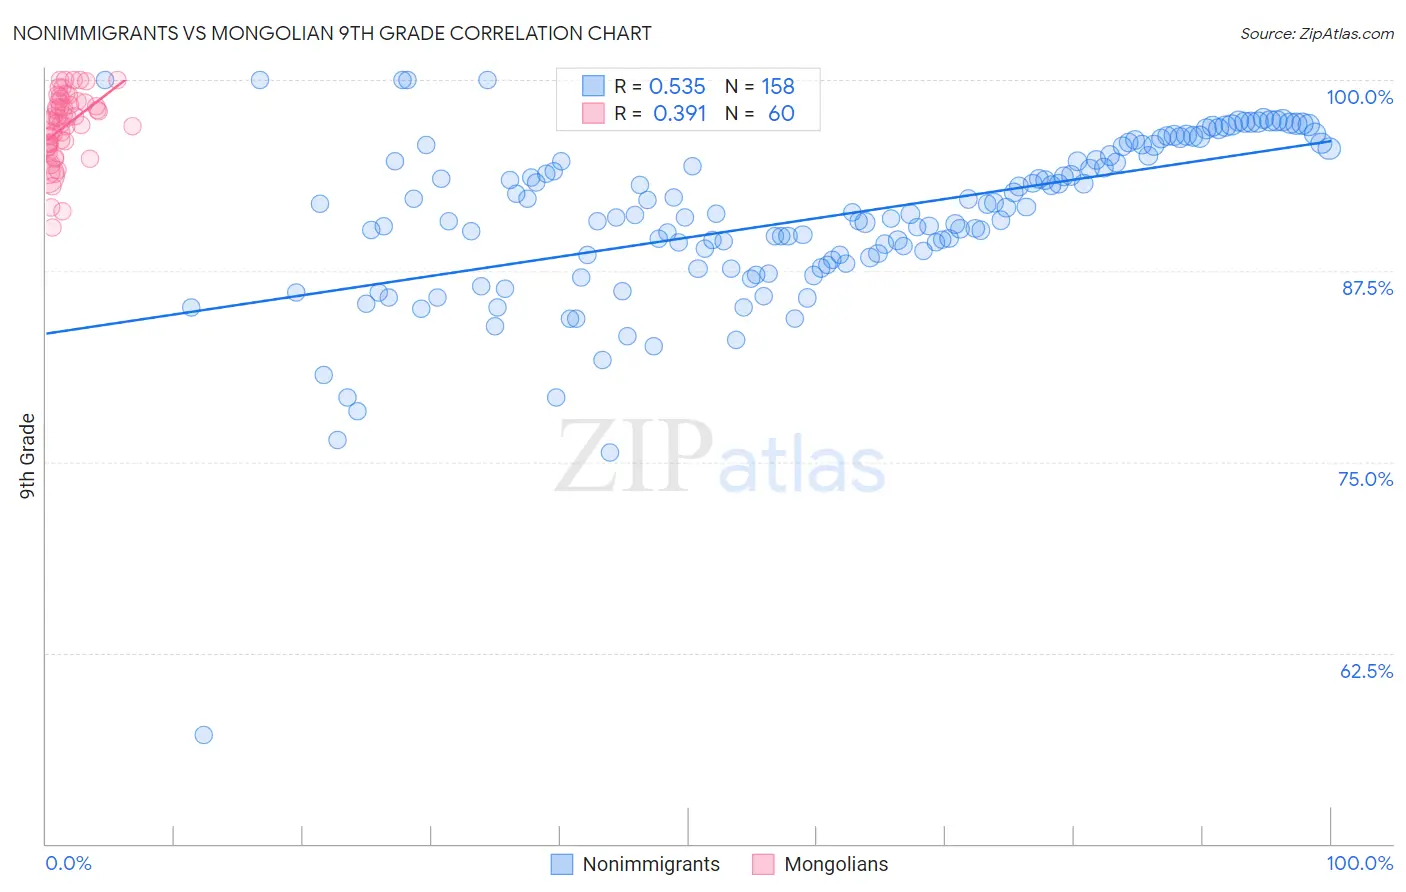
Nonimmigrants vs Mongolian 9th Grade Correlation Chart
The statistical analysis conducted on geographies consisting of 585,372,544 people shows a substantial positive correlation between the proportion of Nonimmigrants and percentage of population with at least 9th grade education in the United States with a correlation coefficient (R) of 0.535 and weighted average of 95.3%. Similarly, the statistical analysis conducted on geographies consisting of 140,247,278 people shows a mild positive correlation between the proportion of Mongolians and percentage of population with at least 9th grade education in the United States with a correlation coefficient (R) of 0.391 and weighted average of 95.0%, a difference of 0.26%.
9th Grade Correlation Summary
| Measurement | Nonimmigrants | Mongolian |
| Minimum | 57.2% | 90.4% |
| Maximum | 100.0% | 100.0% |
| Range | 42.8% | 9.6% |
| Mean | 91.0% | 96.9% |
| Median | 91.2% | 97.3% |
| Interquartile 25% (IQ1) | 88.2% | 95.7% |
| Interquartile 75% (IQ3) | 95.0% | 98.6% |
| Interquartile Range (IQR) | 6.8% | 2.8% |
| Standard Deviation (Sample) | 5.6% | 2.2% |
| Standard Deviation (Population) | 5.6% | 2.2% |
Similar Demographics by 9th Grade
Demographics Similar to Nonimmigrants by 9th Grade
In terms of 9th grade, the demographic groups most similar to Nonimmigrants are Immigrants from North Macedonia (95.3%, a difference of 0.010%), Israeli (95.3%, a difference of 0.030%), Jordanian (95.3%, a difference of 0.040%), Immigrants from Israel (95.3%, a difference of 0.050%), and Immigrants from Hungary (95.4%, a difference of 0.060%).
| Demographics | Rating | Rank | 9th Grade |
| Immigrants | South Central Asia | 95.1 /100 | #125 | Exceptional 95.4% |
| Immigrants | Serbia | 94.4 /100 | #126 | Exceptional 95.4% |
| Palestinians | 94.3 /100 | #127 | Exceptional 95.4% |
| Immigrants | Hungary | 94.2 /100 | #128 | Exceptional 95.4% |
| Basques | 94.1 /100 | #129 | Exceptional 95.4% |
| Jordanians | 93.5 /100 | #130 | Exceptional 95.3% |
| Immigrants | North Macedonia | 92.3 /100 | #131 | Exceptional 95.3% |
| Immigrants | Nonimmigrants | 92.0 /100 | #132 | Exceptional 95.3% |
| Israelis | 90.4 /100 | #133 | Exceptional 95.3% |
| Immigrants | Israel | 89.6 /100 | #134 | Excellent 95.3% |
| Immigrants | Belarus | 88.9 /100 | #135 | Excellent 95.2% |
| Immigrants | Iran | 88.3 /100 | #136 | Excellent 95.2% |
| Hmong | 87.7 /100 | #137 | Excellent 95.2% |
| Immigrants | Russia | 86.6 /100 | #138 | Excellent 95.2% |
| Immigrants | Eastern Europe | 85.8 /100 | #139 | Excellent 95.2% |
Demographics Similar to Mongolians by 9th Grade
In terms of 9th grade, the demographic groups most similar to Mongolians are Immigrants from Kenya (95.0%, a difference of 0.0%), Arab (95.1%, a difference of 0.020%), Immigrants from Kazakhstan (95.1%, a difference of 0.020%), Albanian (95.1%, a difference of 0.030%), and Egyptian (95.0%, a difference of 0.030%).
| Demographics | Rating | Rank | 9th Grade |
| Kenyans | 79.1 /100 | #150 | Good 95.1% |
| Cajuns | 77.3 /100 | #151 | Good 95.1% |
| Ugandans | 77.0 /100 | #152 | Good 95.1% |
| Albanians | 76.1 /100 | #153 | Good 95.1% |
| Arabs | 74.9 /100 | #154 | Good 95.1% |
| Immigrants | Kazakhstan | 74.7 /100 | #155 | Good 95.1% |
| Immigrants | Kenya | 73.1 /100 | #156 | Good 95.0% |
| Mongolians | 73.0 /100 | #157 | Good 95.0% |
| Egyptians | 70.1 /100 | #158 | Good 95.0% |
| Immigrants | Ukraine | 67.4 /100 | #159 | Good 95.0% |
| Immigrants | Italy | 66.6 /100 | #160 | Good 95.0% |
| French American Indians | 66.5 /100 | #161 | Good 95.0% |
| Bermudans | 65.8 /100 | #162 | Good 95.0% |
| Pakistanis | 64.1 /100 | #163 | Good 95.0% |
| Venezuelans | 63.6 /100 | #164 | Good 95.0% |