Immigrants from Brazil vs Potawatomi 7th Grade
COMPARE
Immigrants from Brazil
Potawatomi
7th Grade
7th Grade Comparison
Immigrants from Brazil
Potawatomi
96.0%
7TH GRADE
46.8/ 100
METRIC RATING
180th/ 347
METRIC RANK
96.7%
7TH GRADE
98.9/ 100
METRIC RATING
93rd/ 347
METRIC RANK
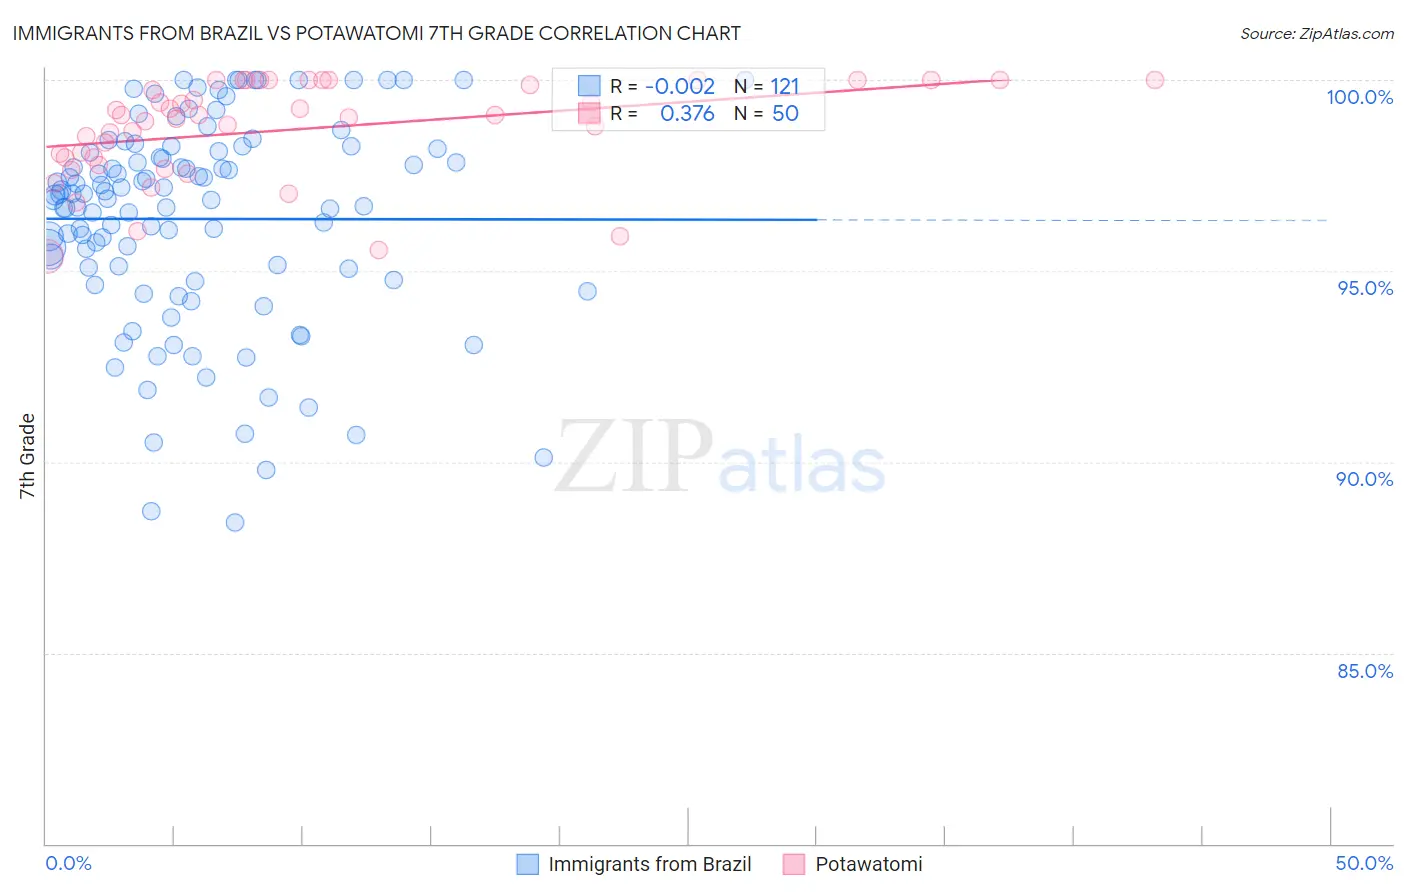
Immigrants from Brazil vs Potawatomi 7th Grade Correlation Chart
The statistical analysis conducted on geographies consisting of 343,021,697 people shows no correlation between the proportion of Immigrants from Brazil and percentage of population with at least 7th grade education in the United States with a correlation coefficient (R) of -0.002 and weighted average of 96.0%. Similarly, the statistical analysis conducted on geographies consisting of 117,769,196 people shows a mild positive correlation between the proportion of Potawatomi and percentage of population with at least 7th grade education in the United States with a correlation coefficient (R) of 0.376 and weighted average of 96.7%, a difference of 0.71%.
7th Grade Correlation Summary
| Measurement | Immigrants from Brazil | Potawatomi |
| Minimum | 88.4% | 95.4% |
| Maximum | 100.0% | 100.0% |
| Range | 11.6% | 4.6% |
| Mean | 96.4% | 98.7% |
| Median | 97.0% | 99.0% |
| Interquartile 25% (IQ1) | 94.9% | 98.0% |
| Interquartile 75% (IQ3) | 98.2% | 100.0% |
| Interquartile Range (IQR) | 3.3% | 2.0% |
| Standard Deviation (Sample) | 2.7% | 1.3% |
| Standard Deviation (Population) | 2.7% | 1.3% |
Similar Demographics by 7th Grade
Demographics Similar to Immigrants from Brazil by 7th Grade
In terms of 7th grade, the demographic groups most similar to Immigrants from Brazil are Immigrants from Korea (96.0%, a difference of 0.010%), Marshallese (96.0%, a difference of 0.010%), Immigrants from Iran (96.0%, a difference of 0.010%), Pakistani (96.0%, a difference of 0.010%), and Immigrants from Albania (96.0%, a difference of 0.020%).
| Demographics | Rating | Rank | 7th Grade |
| Immigrants | Albania | 50.4 /100 | #173 | Average 96.0% |
| Mongolians | 50.0 /100 | #174 | Average 96.0% |
| Blacks/African Americans | 49.5 /100 | #175 | Average 96.0% |
| Chileans | 49.3 /100 | #176 | Average 96.0% |
| Immigrants | Korea | 49.2 /100 | #177 | Average 96.0% |
| Marshallese | 48.4 /100 | #178 | Average 96.0% |
| Immigrants | Iran | 47.8 /100 | #179 | Average 96.0% |
| Immigrants | Brazil | 46.8 /100 | #180 | Average 96.0% |
| Pakistanis | 44.5 /100 | #181 | Average 96.0% |
| Iraqis | 41.2 /100 | #182 | Average 96.0% |
| Immigrants | Spain | 38.8 /100 | #183 | Fair 96.0% |
| Sierra Leoneans | 37.5 /100 | #184 | Fair 96.0% |
| Brazilians | 37.3 /100 | #185 | Fair 96.0% |
| Immigrants | Iraq | 36.1 /100 | #186 | Fair 96.0% |
| Immigrants | Uganda | 36.0 /100 | #187 | Fair 96.0% |
Demographics Similar to Potawatomi by 7th Grade
In terms of 7th grade, the demographic groups most similar to Potawatomi are Osage (96.7%, a difference of 0.0%), Immigrants from Western Europe (96.7%, a difference of 0.0%), Cree (96.7%, a difference of 0.010%), Immigrants from South Africa (96.7%, a difference of 0.010%), and Lebanese (96.7%, a difference of 0.010%).
| Demographics | Rating | Rank | 7th Grade |
| Turks | 99.1 /100 | #86 | Exceptional 96.7% |
| Immigrants | Belgium | 99.0 /100 | #87 | Exceptional 96.7% |
| Puget Sound Salish | 99.0 /100 | #88 | Exceptional 96.7% |
| Cree | 99.0 /100 | #89 | Exceptional 96.7% |
| Immigrants | South Africa | 98.9 /100 | #90 | Exceptional 96.7% |
| Osage | 98.9 /100 | #91 | Exceptional 96.7% |
| Immigrants | Western Europe | 98.9 /100 | #92 | Exceptional 96.7% |
| Potawatomi | 98.9 /100 | #93 | Exceptional 96.7% |
| Lebanese | 98.8 /100 | #94 | Exceptional 96.7% |
| Immigrants | Australia | 98.8 /100 | #95 | Exceptional 96.7% |
| Immigrants | Denmark | 98.7 /100 | #96 | Exceptional 96.7% |
| Immigrants | Germany | 98.7 /100 | #97 | Exceptional 96.7% |
| Immigrants | Sweden | 98.7 /100 | #98 | Exceptional 96.7% |
| Menominee | 98.7 /100 | #99 | Exceptional 96.7% |
| German Russians | 98.6 /100 | #100 | Exceptional 96.7% |