Nonimmigrants vs Cuban Associate's Degree
COMPARE
Nonimmigrants
Cuban
Associate's Degree
Associate's Degree Comparison
Nonimmigrants
Cubans
42.9%
ASSOCIATE'S DEGREE
1.9/ 100
METRIC RATING
237th/ 347
METRIC RANK
41.9%
ASSOCIATE'S DEGREE
0.6/ 100
METRIC RATING
254th/ 347
METRIC RANK
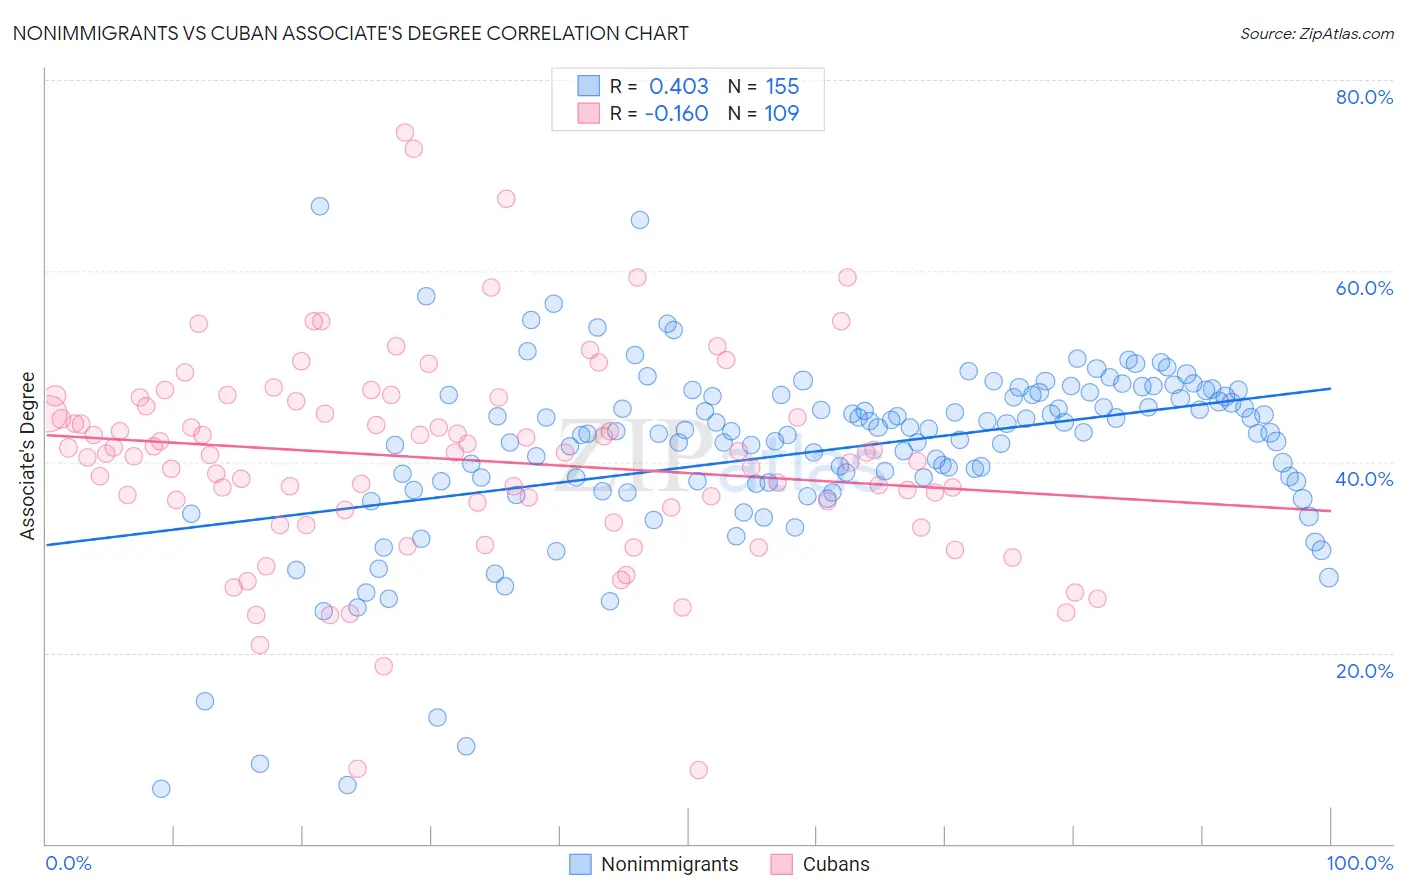
Nonimmigrants vs Cuban Associate's Degree Correlation Chart
The statistical analysis conducted on geographies consisting of 585,078,225 people shows a moderate positive correlation between the proportion of Nonimmigrants and percentage of population with at least associate's degree education in the United States with a correlation coefficient (R) of 0.403 and weighted average of 42.9%. Similarly, the statistical analysis conducted on geographies consisting of 449,326,407 people shows a poor negative correlation between the proportion of Cubans and percentage of population with at least associate's degree education in the United States with a correlation coefficient (R) of -0.160 and weighted average of 41.9%, a difference of 2.5%.
Associate's Degree Correlation Summary
| Measurement | Nonimmigrants | Cuban |
| Minimum | 5.7% | 7.8% |
| Maximum | 66.8% | 74.4% |
| Range | 61.1% | 66.7% |
| Mean | 41.2% | 40.3% |
| Median | 43.1% | 41.0% |
| Interquartile 25% (IQ1) | 37.8% | 35.1% |
| Interquartile 75% (IQ3) | 47.0% | 46.0% |
| Interquartile Range (IQR) | 9.2% | 10.9% |
| Standard Deviation (Sample) | 9.6% | 10.9% |
| Standard Deviation (Population) | 9.6% | 10.8% |
Demographics Similar to Nonimmigrants and Cubans by Associate's Degree
In terms of associate's degree, the demographic groups most similar to Nonimmigrants are Immigrants from St. Vincent and the Grenadines (42.9%, a difference of 0.020%), Ecuadorian (43.0%, a difference of 0.10%), Iroquois (42.8%, a difference of 0.26%), Immigrants from Grenada (42.6%, a difference of 0.76%), and Cree (42.5%, a difference of 0.95%). Similarly, the demographic groups most similar to Cubans are Indonesian (41.9%, a difference of 0.060%), Immigrants from Guyana (41.8%, a difference of 0.090%), French American Indian (42.0%, a difference of 0.17%), Immigrants from Bahamas (42.1%, a difference of 0.53%), and U.S. Virgin Islander (42.1%, a difference of 0.55%).
| Demographics | Rating | Rank | Associate's Degree |
| Ecuadorians | 2.0 /100 | #235 | Tragic 43.0% |
| Immigrants | St. Vincent and the Grenadines | 1.9 /100 | #236 | Tragic 42.9% |
| Immigrants | Nonimmigrants | 1.9 /100 | #237 | Tragic 42.9% |
| Iroquois | 1.7 /100 | #238 | Tragic 42.8% |
| Immigrants | Grenada | 1.3 /100 | #239 | Tragic 42.6% |
| Cree | 1.2 /100 | #240 | Tragic 42.5% |
| British West Indians | 1.0 /100 | #241 | Tragic 42.4% |
| Immigrants | West Indies | 1.0 /100 | #242 | Tragic 42.4% |
| Guyanese | 1.0 /100 | #243 | Tragic 42.3% |
| Immigrants | Liberia | 0.9 /100 | #244 | Tragic 42.3% |
| Immigrants | Cambodia | 0.9 /100 | #245 | Tragic 42.3% |
| Delaware | 0.9 /100 | #246 | Tragic 42.3% |
| Immigrants | Fiji | 0.8 /100 | #247 | Tragic 42.2% |
| Immigrants | Ecuador | 0.8 /100 | #248 | Tragic 42.2% |
| Jamaicans | 0.7 /100 | #249 | Tragic 42.1% |
| U.S. Virgin Islanders | 0.7 /100 | #250 | Tragic 42.1% |
| Immigrants | Bahamas | 0.7 /100 | #251 | Tragic 42.1% |
| French American Indians | 0.6 /100 | #252 | Tragic 42.0% |
| Indonesians | 0.6 /100 | #253 | Tragic 41.9% |
| Cubans | 0.6 /100 | #254 | Tragic 41.9% |
| Immigrants | Guyana | 0.5 /100 | #255 | Tragic 41.8% |