Immigrants from Egypt vs Chilean Doctorate Degree

COMPARE

Immigrants from Egypt
Race
Ancestry
AfghanAfricanAlaska NativeAlaskan AthabascanAlbanianAleutAlsatianAmericanApacheArabArapahoArgentineanArmenianAssyrian/Chaldean/SyriacAustralianAustrianBahamianBangladeshiBarbadianBasqueBelgianBelizeanBermudanBhutaneseBlackfeetBolivianBrazilianBritishBritish West IndianBulgarianBurmeseCajunCambodianCanadianCape VerdeanCarpatho RusynCelticCentral AmericanCentral American IndianCherokeeCheyenneChickasawChineseChippewaChoctawColombianColvilleComancheCosta RicanCreeCreekCroatianCrowCubanCypriotCzechCzechoslovakianDanishDelawareDominicanDutchDutch West IndianEastern EuropeanEcuadorianEgyptianEnglishEstonianEthiopianEuropeanFijianFilipinoFinnishFrenchFrench American IndianFrench CanadianGermanGerman RussianGhanaianGreekGuamanian/ChamorroGuatemalanGuyaneseHaitianHmongHonduranHopiHoumaHungarianIcelanderIndian (Asian)IndonesianInupiatIranianIraqiIrishIroquoisIsraeliItalianJamaicanJapaneseJordanianKenyanKiowaKoreanLaotianLatvianLebaneseLiberianLithuanianLumbeeLuxembourgerMacedonianMalaysianMalteseMarshalleseMenomineeMexicanMexican American IndianMongolianMoroccanNative HawaiianNavajoNepaleseNew ZealanderNicaraguanNigerianNorthern EuropeanNorwegianOkinawanOsageOttawaPaiutePakistaniPalestinianPanamanianParaguayanPennsylvania GermanPeruvianPimaPolishPortuguesePotawatomiPuebloPuerto RicanPuget Sound SalishRomanianRussianSalvadoranSamoanScandinavianScotch-IrishScottishSeminoleSenegaleseSerbianShoshoneSierra LeoneanSiouxSlavicSlovakSloveneSomaliSouth AfricanSouth AmericanSouth American IndianSoviet UnionSpaniardSpanishSpanish AmericanSpanish American IndianSri LankanSubsaharan AfricanSudaneseSwedishSwissSyrianTaiwaneseThaiTlingit-HaidaTohono O'OdhamTonganTrinidadian and TobagonianTsimshianTurkishU.S. Virgin IslanderUgandanUkrainianUruguayanUteVenezuelanVietnameseWelshWest IndianYakamaYaquiYugoslavianYumanYup'ikZimbabwean
Immigration
NonimmigrantsImmigrantsAfghanistanAfricaAlbaniaArgentinaArmeniaAsiaAustraliaAustriaBahamasBangladeshBarbadosBelarusBelgiumBelizeBoliviaBosnia and HerzegovinaBrazilBulgariaBurma/MyanmarCabo VerdeCambodiaCameroonCanadaCaribbeanCentral AmericaChileChinaColombiaCongoCosta RicaCroatiaCubaCzechoslovakiaDenmarkDominicaDominican RepublicEastern AfricaEastern AsiaEastern EuropeEcuadorEgyptEl SalvadorEnglandEritreaEthiopiaEuropeFijiFranceGermanyGhanaGreeceGrenadaGuatemalaGuyanaHaitiHondurasHong KongHungaryIndiaIndonesiaIranIraqIrelandIsraelItalyJamaicaJapanJordanKazakhstanKenyaKoreaKuwaitLaosLatin AmericaLatviaLebanonLiberiaLithuaniaMalaysiaMexicoMicronesiaMiddle AfricaMoldovaMoroccoNepalNetherlandsNicaraguaNigeriaNorth AmericaNorth MacedoniaNorthern AfricaNorthern EuropeNorwayOceaniaPakistanPanamaPeruPhilippinesPolandPortugalRomaniaRussiaSaudi ArabiaScotlandSenegalSerbiaSierra LeoneSingaporeSomaliaSouth AfricaSouth AmericaSouth Central AsiaSouth Eastern AsiaSouthern EuropeSpainSri LankaSt. Vincent and the GrenadinesSudanSwedenSwitzerlandSyriaTaiwanThailandTrinidad and TobagoTurkeyUgandaUkraineUruguayUzbekistanVenezuelaVietnamWest IndiesWestern AfricaWestern AsiaWestern EuropeYemenZaireZimbabweAzores
Chilean
Race
Ancestry
AfghanAfricanAlaska NativeAlaskan AthabascanAlbanianAleutAlsatianAmericanApacheArabArapahoArgentineanArmenianAssyrian/Chaldean/SyriacAustralianAustrianBahamianBangladeshiBarbadianBasqueBelgianBelizeanBermudanBhutaneseBlackfeetBolivianBrazilianBritishBritish West IndianBulgarianBurmeseCajunCambodianCanadianCape VerdeanCarpatho RusynCelticCentral AmericanCentral American IndianCherokeeCheyenneChickasawChileanChineseChippewaChoctawColombianColvilleComancheCosta RicanCreeCreekCroatianCrowCubanCypriotCzechCzechoslovakianDanishDelawareDominicanDutchDutch West IndianEastern EuropeanEcuadorianEgyptianEnglishEstonianEthiopianEuropeanFijianFilipinoFinnishFrenchFrench American IndianFrench CanadianGermanGerman RussianGhanaianGreekGuamanian/ChamorroGuatemalanGuyaneseHaitianHmongHonduranHopiHoumaHungarianIcelanderIndian (Asian)IndonesianInupiatIranianIraqiIrishIroquoisIsraeliItalianJamaicanJapaneseJordanianKenyanKiowaKoreanLaotianLatvianLebaneseLiberianLithuanianLumbeeLuxembourgerMacedonianMalaysianMalteseMarshalleseMenomineeMexicanMexican American IndianMongolianMoroccanNative HawaiianNavajoNepaleseNew ZealanderNicaraguanNigerianNorthern EuropeanNorwegianOkinawanOsageOttawaPaiutePakistaniPalestinianPanamanianParaguayanPennsylvania GermanPeruvianPimaPolishPortuguesePotawatomiPuebloPuerto RicanPuget Sound SalishRomanianRussianSalvadoranSamoanScandinavianScotch-IrishScottishSeminoleSenegaleseSerbianShoshoneSierra LeoneanSiouxSlavicSlovakSloveneSomaliSouth AfricanSouth AmericanSouth American IndianSoviet UnionSpaniardSpanishSpanish AmericanSpanish American IndianSri LankanSubsaharan AfricanSudaneseSwedishSwissSyrianTaiwaneseThaiTlingit-HaidaTohono O'OdhamTonganTrinidadian and TobagonianTsimshianTurkishU.S. Virgin IslanderUgandanUkrainianUruguayanUteVenezuelanVietnameseWelshWest IndianYakamaYaquiYugoslavianYumanYup'ikZimbabwean
Immigration
NonimmigrantsImmigrantsAfghanistanAfricaAlbaniaArgentinaArmeniaAsiaAustraliaAustriaBahamasBangladeshBarbadosBelarusBelgiumBelizeBoliviaBosnia and HerzegovinaBrazilBulgariaBurma/MyanmarCabo VerdeCambodiaCameroonCanadaCaribbeanCentral AmericaChileChinaColombiaCongoCosta RicaCroatiaCubaCzechoslovakiaDenmarkDominicaDominican RepublicEastern AfricaEastern AsiaEastern EuropeEcuadorEl SalvadorEnglandEritreaEthiopiaEuropeFijiFranceGermanyGhanaGreeceGrenadaGuatemalaGuyanaHaitiHondurasHong KongHungaryIndiaIndonesiaIranIraqIrelandIsraelItalyJamaicaJapanJordanKazakhstanKenyaKoreaKuwaitLaosLatin AmericaLatviaLebanonLiberiaLithuaniaMalaysiaMexicoMicronesiaMiddle AfricaMoldovaMoroccoNepalNetherlandsNicaraguaNigeriaNorth AmericaNorth MacedoniaNorthern AfricaNorthern EuropeNorwayOceaniaPakistanPanamaPeruPhilippinesPolandPortugalRomaniaRussiaSaudi ArabiaScotlandSenegalSerbiaSierra LeoneSingaporeSomaliaSouth AfricaSouth AmericaSouth Central AsiaSouth Eastern AsiaSouthern EuropeSpainSri LankaSt. Vincent and the GrenadinesSudanSwedenSwitzerlandSyriaTaiwanThailandTrinidad and TobagoTurkeyUgandaUkraineUruguayUzbekistanVenezuelaVietnamWest IndiesWestern AfricaWestern AsiaWestern EuropeYemenZaireZimbabweAzores
Doctorate Degree
Income
Poverty
Unemployment
Labor Participation
Family Structure
Vehicle Availability
Education Level
Disability

Doctorate Degree Comparison

Immigrants from Egypt

Chileans

Exceptional
Exceptional
2.1%
DOCTORATE DEGREE
98.2/ 100
METRIC RATING
99th/ 347
METRIC RANK
2.2%
DOCTORATE DEGREE
99.1/ 100
METRIC RATING
92nd/ 347
METRIC RANK

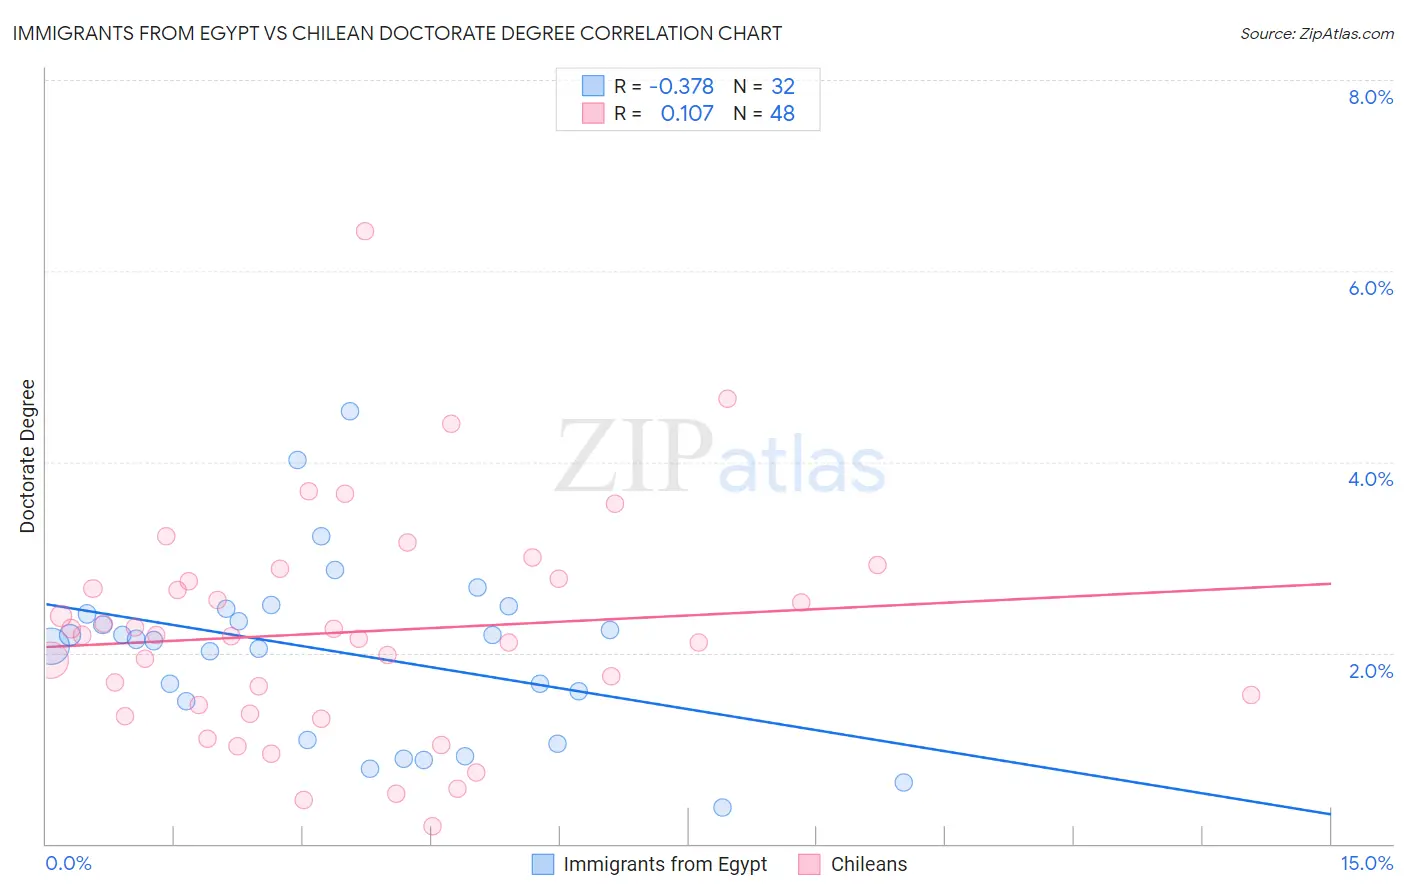
Immigrants from Egypt vs Chilean Doctorate Degree Correlation Chart

The statistical analysis conducted on geographies consisting of 244,806,007 people shows a mild negative correlation between the proportion of Immigrants from Egypt and percentage of population with at least doctorate degree education in the United States with a correlation coefficient (R) of -0.378 and weighted average of 2.1%. Similarly, the statistical analysis conducted on geographies consisting of 255,786,366 people shows a poor positive correlation between the proportion of Chileans and percentage of population with at least doctorate degree education in the United States with a correlation coefficient (R) of 0.107 and weighted average of 2.2%, a difference of 2.0%.
Immigrants from Egypt vs Chilean Doctorate Degree

Doctorate Degree Correlation Summary

MeasurementImmigrants from EgyptChilean
Minimum0.38%0.19%
Maximum4.5%6.4%
Range4.1%6.2%
Mean2.0%2.2%
Median2.1%2.2%
Interquartile 25% (IQ1)1.3%1.4%
Interquartile 75% (IQ3)2.4%2.8%
Interquartile Range (IQR)1.1%1.4%
Standard Deviation (Sample)0.92%1.2%
Standard Deviation (Population)0.91%1.2%

Demographics Similar to Immigrants from Egypt and Chileans by Doctorate Degree

In terms of doctorate degree, the demographic groups most similar to Immigrants from Egypt are Immigrants from Eastern Europe (2.1%, a difference of 0.0%), Immigrants from Eastern Africa (2.1%, a difference of 0.030%), Armenian (2.1%, a difference of 0.18%), Immigrants from Chile (2.1%, a difference of 0.25%), and Immigrants from Eritrea (2.1%, a difference of 0.26%). Similarly, the demographic groups most similar to Chileans are Alsatian (2.1%, a difference of 0.22%), Immigrants from Sudan (2.2%, a difference of 0.26%), Immigrants from Scotland (2.2%, a difference of 0.73%), British (2.2%, a difference of 0.75%), and Greek (2.1%, a difference of 0.85%).
DemographicsRating | RankDoctorate Degree
Immigrants | Brazil
99.6
/100
|
#85
Exceptional
2.2%
Egyptians
99.4
/100
|
#86
Exceptional
2.2%
Immigrants | Zimbabwe
99.4
/100
|
#87
Exceptional
2.2%
Immigrants | Nepal
99.3
/100
|
#88
Exceptional
2.2%
British
99.3
/100
|
#89
Exceptional
2.2%
Immigrants | Scotland
99.2
/100
|
#90
Exceptional
2.2%
Immigrants | Sudan
99.1
/100
|
#91
Exceptional
2.2%
Chileans
99.1
/100
|
#92
Exceptional
2.2%
Alsatians
99.0
/100
|
#93
Exceptional
2.1%
Greeks
98.8
/100
|
#94
Exceptional
2.1%
Immigrants | Romania
98.7
/100
|
#95
Exceptional
2.1%
Immigrants | Northern Africa
98.4
/100
|
#96
Exceptional
2.1%
Immigrants | Eritrea
98.4
/100
|
#97
Exceptional
2.1%
Armenians
98.3
/100
|
#98
Exceptional
2.1%
Immigrants | Egypt
98.2
/100
|
#99
Exceptional
2.1%
Immigrants | Eastern Europe
98.2
/100
|
#100
Exceptional
2.1%
Immigrants | Eastern Africa
98.2
/100
|
#101
Exceptional
2.1%
Immigrants | Chile
98.1
/100
|
#102
Exceptional
2.1%
Romanians
98.1
/100
|
#103
Exceptional
2.1%
Austrians
98.0
/100
|
#104
Exceptional
2.1%
Arabs
97.8
/100
|
#105
Exceptional
2.1%