Dutch West Indian vs Thai 4th Grade
COMPARE
Dutch West Indian
Thai
4th Grade
4th Grade Comparison
Dutch West Indians
Thais
97.5%
4TH GRADE
35.8/ 100
METRIC RATING
186th/ 347
METRIC RANK
97.8%
4TH GRADE
96.7/ 100
METRIC RATING
110th/ 347
METRIC RANK
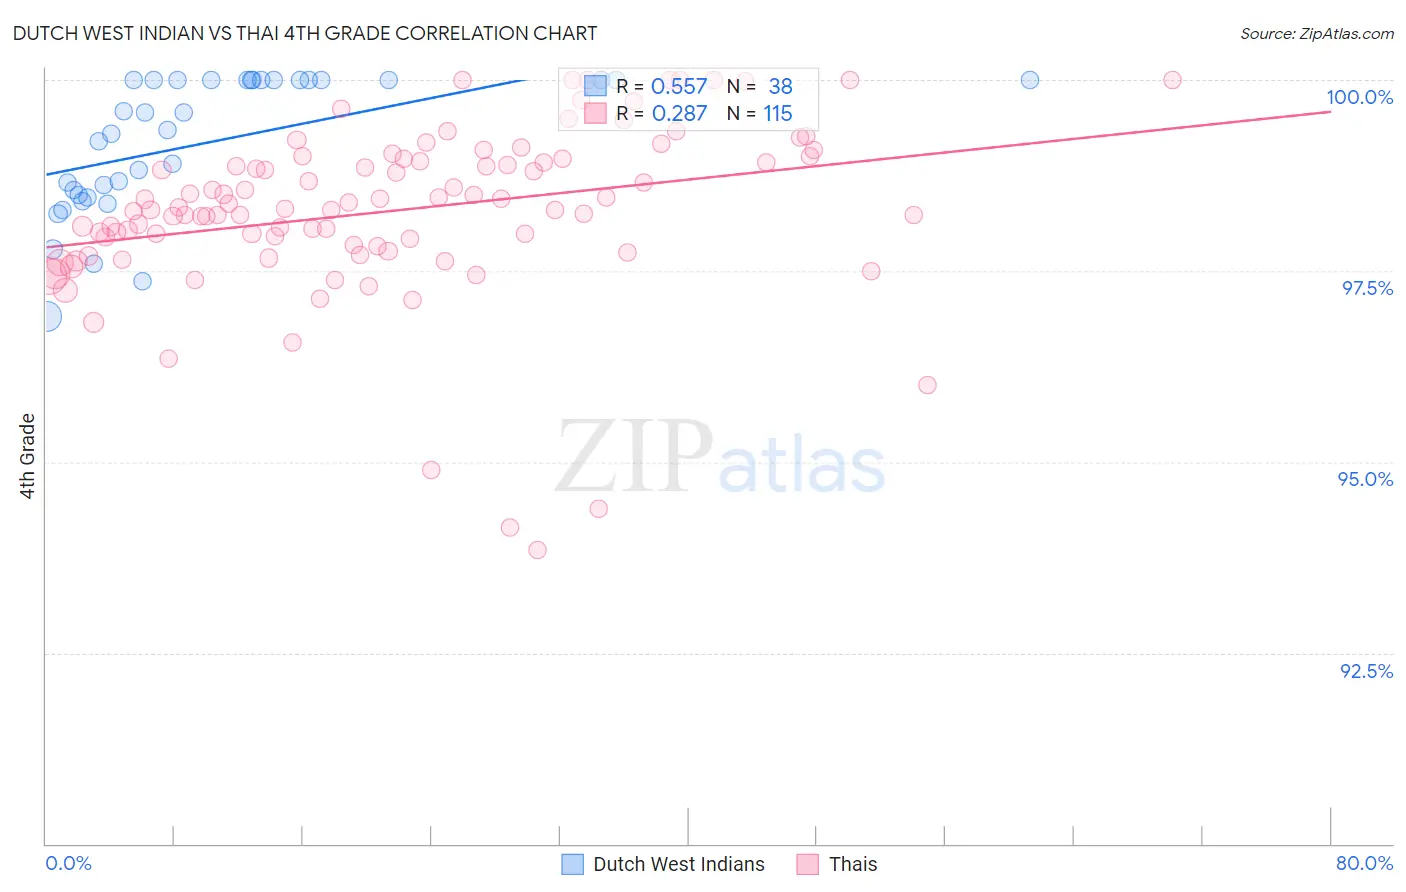
Dutch West Indian vs Thai 4th Grade Correlation Chart
The statistical analysis conducted on geographies consisting of 85,776,075 people shows a substantial positive correlation between the proportion of Dutch West Indians and percentage of population with at least 4th grade education in the United States with a correlation coefficient (R) of 0.557 and weighted average of 97.5%. Similarly, the statistical analysis conducted on geographies consisting of 475,866,115 people shows a weak positive correlation between the proportion of Thais and percentage of population with at least 4th grade education in the United States with a correlation coefficient (R) of 0.287 and weighted average of 97.8%, a difference of 0.37%.
4th Grade Correlation Summary
| Measurement | Dutch West Indian | Thai |
| Minimum | 96.9% | 93.8% |
| Maximum | 100.0% | 100.0% |
| Range | 3.1% | 6.2% |
| Mean | 99.2% | 98.3% |
| Median | 99.5% | 98.3% |
| Interquartile 25% (IQ1) | 98.5% | 97.8% |
| Interquartile 75% (IQ3) | 100.0% | 99.0% |
| Interquartile Range (IQR) | 1.5% | 1.1% |
| Standard Deviation (Sample) | 0.89% | 1.1% |
| Standard Deviation (Population) | 0.88% | 1.1% |
Similar Demographics by 4th Grade
Demographics Similar to Dutch West Indians by 4th Grade
In terms of 4th grade, the demographic groups most similar to Dutch West Indians are Pakistani (97.5%, a difference of 0.0%), Immigrants from Kenya (97.5%, a difference of 0.0%), Mongolian (97.5%, a difference of 0.0%), Immigrants from Argentina (97.5%, a difference of 0.0%), and Spanish American (97.5%, a difference of 0.010%).
| Demographics | Rating | Rank | 4th Grade |
| Immigrants | Kazakhstan | 43.6 /100 | #179 | Average 97.5% |
| Immigrants | Venezuela | 42.7 /100 | #180 | Average 97.5% |
| Immigrants | Taiwan | 41.5 /100 | #181 | Average 97.5% |
| Spanish Americans | 39.3 /100 | #182 | Fair 97.5% |
| Argentineans | 39.0 /100 | #183 | Fair 97.5% |
| Pakistanis | 36.2 /100 | #184 | Fair 97.5% |
| Immigrants | Kenya | 35.8 /100 | #185 | Fair 97.5% |
| Dutch West Indians | 35.8 /100 | #186 | Fair 97.5% |
| Mongolians | 34.7 /100 | #187 | Fair 97.5% |
| Immigrants | Argentina | 34.6 /100 | #188 | Fair 97.5% |
| Panamanians | 31.9 /100 | #189 | Fair 97.4% |
| Blacks/African Americans | 31.1 /100 | #190 | Fair 97.4% |
| Navajo | 30.7 /100 | #191 | Fair 97.4% |
| Immigrants | Ukraine | 30.1 /100 | #192 | Fair 97.4% |
| Immigrants | Egypt | 30.1 /100 | #193 | Fair 97.4% |
Demographics Similar to Thais by 4th Grade
In terms of 4th grade, the demographic groups most similar to Thais are Immigrants from Latvia (97.8%, a difference of 0.0%), Immigrants from Switzerland (97.8%, a difference of 0.010%), Bhutanese (97.9%, a difference of 0.020%), Immigrants from Singapore (97.9%, a difference of 0.020%), and Okinawan (97.8%, a difference of 0.020%).
| Demographics | Rating | Rank | 4th Grade |
| Puget Sound Salish | 97.7 /100 | #103 | Exceptional 97.9% |
| Immigrants | Nonimmigrants | 97.5 /100 | #104 | Exceptional 97.9% |
| German Russians | 97.5 /100 | #105 | Exceptional 97.9% |
| Immigrants | Czechoslovakia | 97.5 /100 | #106 | Exceptional 97.9% |
| Bhutanese | 97.4 /100 | #107 | Exceptional 97.9% |
| Immigrants | Singapore | 97.3 /100 | #108 | Exceptional 97.9% |
| Immigrants | Latvia | 96.8 /100 | #109 | Exceptional 97.8% |
| Thais | 96.7 /100 | #110 | Exceptional 97.8% |
| Immigrants | Switzerland | 96.1 /100 | #111 | Exceptional 97.8% |
| Okinawans | 96.0 /100 | #112 | Exceptional 97.8% |
| Basques | 95.8 /100 | #113 | Exceptional 97.8% |
| Iroquois | 95.4 /100 | #114 | Exceptional 97.8% |
| Lebanese | 95.4 /100 | #115 | Exceptional 97.8% |
| Immigrants | Croatia | 95.2 /100 | #116 | Exceptional 97.8% |
| Syrians | 94.9 /100 | #117 | Exceptional 97.8% |