Nigerian vs Immigrants from Lithuania High School Diploma
COMPARE
Nigerian
Immigrants from Lithuania
High School Diploma
High School Diploma Comparison
Nigerians
Immigrants from Lithuania
88.2%
HIGH SCHOOL DIPLOMA
5.2/ 100
METRIC RATING
229th/ 347
METRIC RANK
91.3%
HIGH SCHOOL DIPLOMA
99.8/ 100
METRIC RATING
40th/ 347
METRIC RANK
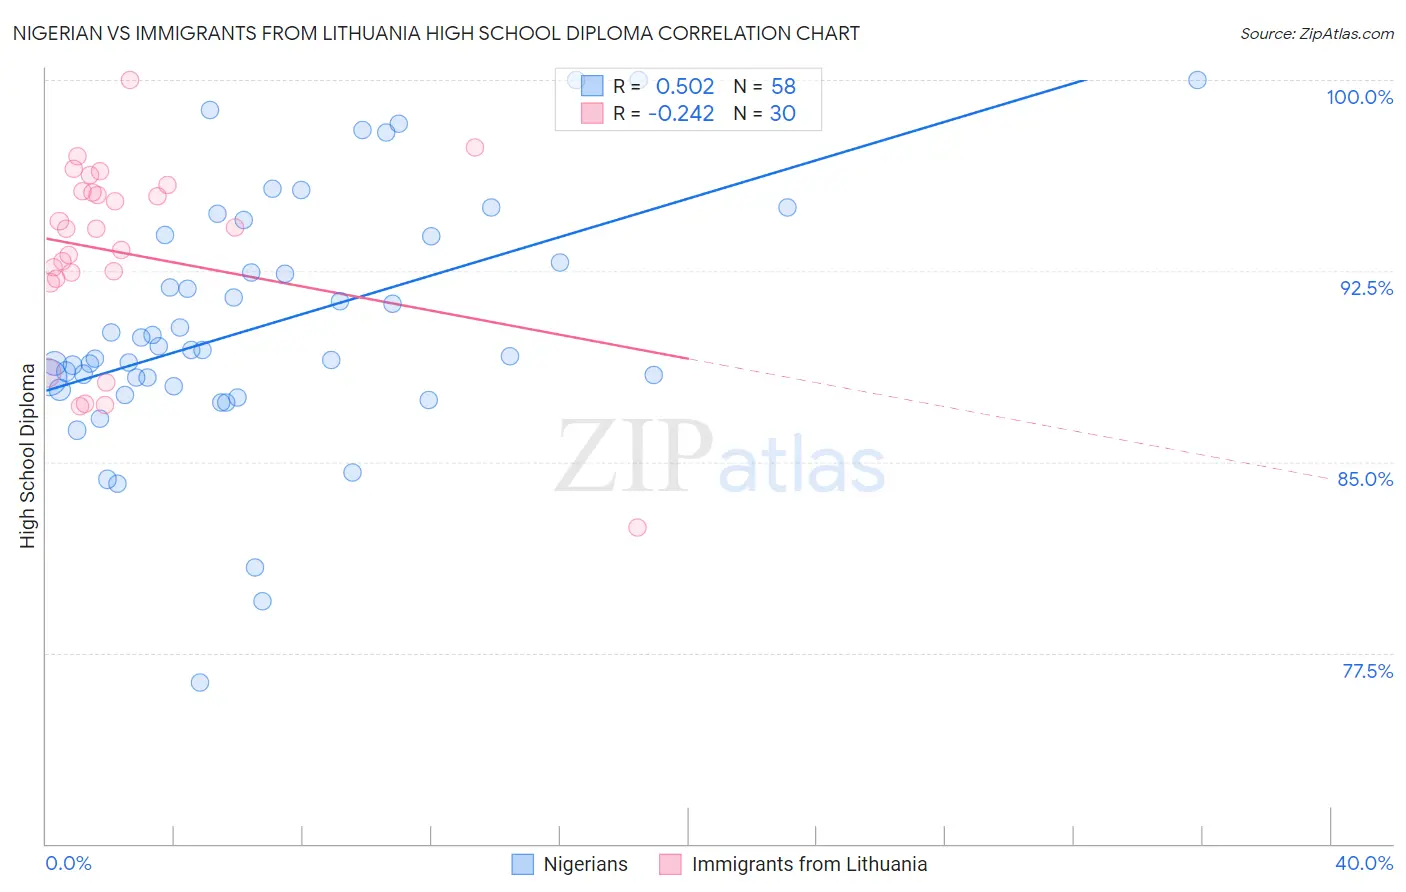
Nigerian vs Immigrants from Lithuania High School Diploma Correlation Chart
The statistical analysis conducted on geographies consisting of 332,724,627 people shows a substantial positive correlation between the proportion of Nigerians and percentage of population with at least high school diploma education in the United States with a correlation coefficient (R) of 0.502 and weighted average of 88.2%. Similarly, the statistical analysis conducted on geographies consisting of 117,724,932 people shows a weak negative correlation between the proportion of Immigrants from Lithuania and percentage of population with at least high school diploma education in the United States with a correlation coefficient (R) of -0.242 and weighted average of 91.3%, a difference of 3.5%.
High School Diploma Correlation Summary
| Measurement | Nigerian | Immigrants from Lithuania |
| Minimum | 76.3% | 82.4% |
| Maximum | 100.0% | 100.0% |
| Range | 23.7% | 17.6% |
| Mean | 90.4% | 93.2% |
| Median | 89.4% | 94.1% |
| Interquartile 25% (IQ1) | 88.0% | 92.2% |
| Interquartile 75% (IQ3) | 93.9% | 95.6% |
| Interquartile Range (IQR) | 5.9% | 3.4% |
| Standard Deviation (Sample) | 4.9% | 3.8% |
| Standard Deviation (Population) | 4.8% | 3.7% |
Similar Demographics by High School Diploma
Demographics Similar to Nigerians by High School Diploma
In terms of high school diploma, the demographic groups most similar to Nigerians are Kiowa (88.2%, a difference of 0.010%), Immigrants from Liberia (88.2%, a difference of 0.020%), Uruguayan (88.2%, a difference of 0.030%), Blackfeet (88.1%, a difference of 0.080%), and Creek (88.3%, a difference of 0.11%).
| Demographics | Rating | Rank | High School Diploma |
| Colville | 7.8 /100 | #222 | Tragic 88.3% |
| Immigrants | Zaire | 7.6 /100 | #223 | Tragic 88.3% |
| Shoshone | 7.0 /100 | #224 | Tragic 88.3% |
| Creek | 6.9 /100 | #225 | Tragic 88.3% |
| Uruguayans | 5.6 /100 | #226 | Tragic 88.2% |
| Immigrants | Liberia | 5.5 /100 | #227 | Tragic 88.2% |
| Kiowa | 5.3 /100 | #228 | Tragic 88.2% |
| Nigerians | 5.2 /100 | #229 | Tragic 88.2% |
| Blackfeet | 4.2 /100 | #230 | Tragic 88.1% |
| Colombians | 3.8 /100 | #231 | Tragic 88.1% |
| Immigrants | Middle Africa | 3.4 /100 | #232 | Tragic 88.0% |
| Immigrants | Panama | 3.1 /100 | #233 | Tragic 88.0% |
| Immigrants | Thailand | 3.1 /100 | #234 | Tragic 88.0% |
| Immigrants | Bahamas | 2.9 /100 | #235 | Tragic 88.0% |
| Sub-Saharan Africans | 2.8 /100 | #236 | Tragic 87.9% |
Demographics Similar to Immigrants from Lithuania by High School Diploma
In terms of high school diploma, the demographic groups most similar to Immigrants from Lithuania are Dutch (91.3%, a difference of 0.0%), Immigrants from Scotland (91.3%, a difference of 0.020%), Immigrants from Australia (91.3%, a difference of 0.020%), Northern European (91.3%, a difference of 0.030%), and Immigrants from Ireland (91.3%, a difference of 0.040%).
| Demographics | Rating | Rank | High School Diploma |
| Okinawans | 99.9 /100 | #33 | Exceptional 91.4% |
| Scottish | 99.9 /100 | #34 | Exceptional 91.4% |
| Irish | 99.9 /100 | #35 | Exceptional 91.4% |
| Tsimshian | 99.9 /100 | #36 | Exceptional 91.3% |
| Immigrants | Ireland | 99.9 /100 | #37 | Exceptional 91.3% |
| Immigrants | Scotland | 99.8 /100 | #38 | Exceptional 91.3% |
| Dutch | 99.8 /100 | #39 | Exceptional 91.3% |
| Immigrants | Lithuania | 99.8 /100 | #40 | Exceptional 91.3% |
| Immigrants | Australia | 99.8 /100 | #41 | Exceptional 91.3% |
| Northern Europeans | 99.8 /100 | #42 | Exceptional 91.3% |
| British | 99.8 /100 | #43 | Exceptional 91.3% |
| Immigrants | Austria | 99.8 /100 | #44 | Exceptional 91.3% |
| Turks | 99.8 /100 | #45 | Exceptional 91.2% |
| Greeks | 99.8 /100 | #46 | Exceptional 91.2% |
| Australians | 99.8 /100 | #47 | Exceptional 91.2% |