Nigerian vs Immigrants from Lithuania 6th Grade
COMPARE
Nigerian
Immigrants from Lithuania
6th Grade
6th Grade Comparison
Nigerians
Immigrants from Lithuania
96.6%
6TH GRADE
1.9/ 100
METRIC RATING
238th/ 347
METRIC RANK
97.6%
6TH GRADE
99.3/ 100
METRIC RATING
77th/ 347
METRIC RANK
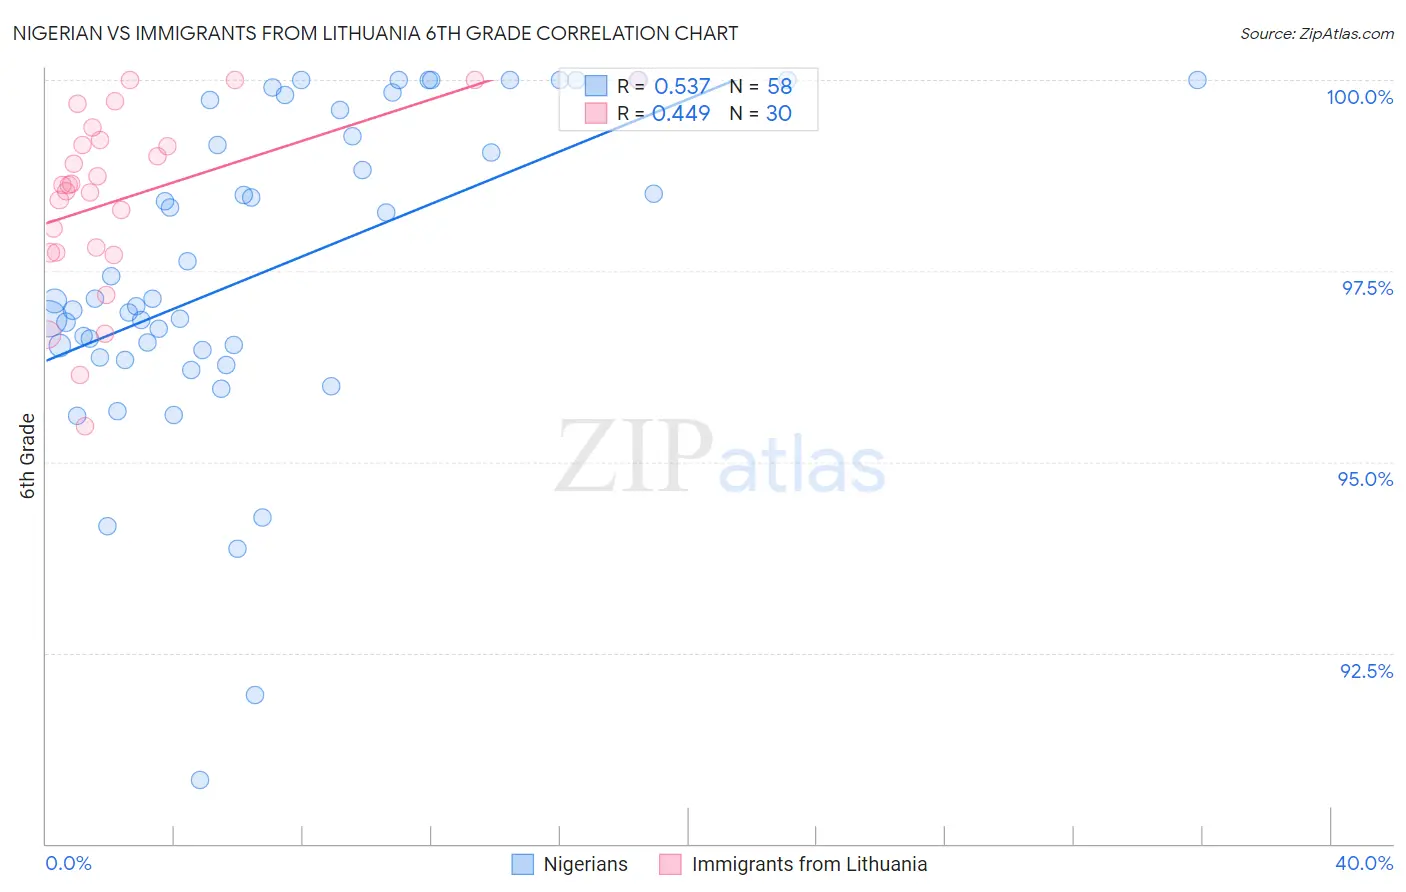
Nigerian vs Immigrants from Lithuania 6th Grade Correlation Chart
The statistical analysis conducted on geographies consisting of 332,724,627 people shows a substantial positive correlation between the proportion of Nigerians and percentage of population with at least 6th grade education in the United States with a correlation coefficient (R) of 0.537 and weighted average of 96.6%. Similarly, the statistical analysis conducted on geographies consisting of 117,724,932 people shows a moderate positive correlation between the proportion of Immigrants from Lithuania and percentage of population with at least 6th grade education in the United States with a correlation coefficient (R) of 0.449 and weighted average of 97.6%, a difference of 1.0%.
6th Grade Correlation Summary
| Measurement | Nigerian | Immigrants from Lithuania |
| Minimum | 90.8% | 95.5% |
| Maximum | 100.0% | 100.0% |
| Range | 9.2% | 4.5% |
| Mean | 97.5% | 98.5% |
| Median | 97.1% | 98.6% |
| Interquartile 25% (IQ1) | 96.5% | 97.7% |
| Interquartile 75% (IQ3) | 99.6% | 99.2% |
| Interquartile Range (IQR) | 3.1% | 1.5% |
| Standard Deviation (Sample) | 2.1% | 1.2% |
| Standard Deviation (Population) | 2.0% | 1.2% |
Similar Demographics by 6th Grade
Demographics Similar to Nigerians by 6th Grade
In terms of 6th grade, the demographic groups most similar to Nigerians are Indian (Asian) (96.6%, a difference of 0.0%), Korean (96.6%, a difference of 0.0%), Senegalese (96.6%, a difference of 0.0%), Immigrants from Eastern Africa (96.6%, a difference of 0.010%), and Immigrants from Asia (96.6%, a difference of 0.010%).
| Demographics | Rating | Rank | 6th Grade |
| Sub-Saharan Africans | 3.5 /100 | #231 | Tragic 96.7% |
| South American Indians | 3.5 /100 | #232 | Tragic 96.7% |
| Yuman | 3.2 /100 | #233 | Tragic 96.7% |
| Uruguayans | 2.5 /100 | #234 | Tragic 96.6% |
| Asians | 2.4 /100 | #235 | Tragic 96.6% |
| Immigrants | Indonesia | 2.3 /100 | #236 | Tragic 96.6% |
| Immigrants | Eastern Africa | 2.0 /100 | #237 | Tragic 96.6% |
| Nigerians | 1.9 /100 | #238 | Tragic 96.6% |
| Indians (Asian) | 1.9 /100 | #239 | Tragic 96.6% |
| Koreans | 1.9 /100 | #240 | Tragic 96.6% |
| Senegalese | 1.8 /100 | #241 | Tragic 96.6% |
| Immigrants | Asia | 1.8 /100 | #242 | Tragic 96.6% |
| Immigrants | Liberia | 1.6 /100 | #243 | Tragic 96.6% |
| Ethiopians | 1.5 /100 | #244 | Tragic 96.6% |
| Immigrants | Costa Rica | 1.3 /100 | #245 | Tragic 96.6% |
Demographics Similar to Immigrants from Lithuania by 6th Grade
In terms of 6th grade, the demographic groups most similar to Immigrants from Lithuania are Icelander (97.6%, a difference of 0.0%), Immigrants from Netherlands (97.6%, a difference of 0.010%), Ukrainian (97.6%, a difference of 0.010%), Immigrants from England (97.6%, a difference of 0.010%), and Immigrants from India (97.6%, a difference of 0.010%).
| Demographics | Rating | Rank | 6th Grade |
| Cajuns | 99.5 /100 | #70 | Exceptional 97.6% |
| Chickasaw | 99.5 /100 | #71 | Exceptional 97.6% |
| Macedonians | 99.4 /100 | #72 | Exceptional 97.6% |
| Cherokee | 99.4 /100 | #73 | Exceptional 97.6% |
| Immigrants | Netherlands | 99.4 /100 | #74 | Exceptional 97.6% |
| Ukrainians | 99.4 /100 | #75 | Exceptional 97.6% |
| Immigrants | England | 99.4 /100 | #76 | Exceptional 97.6% |
| Immigrants | Lithuania | 99.3 /100 | #77 | Exceptional 97.6% |
| Icelanders | 99.3 /100 | #78 | Exceptional 97.6% |
| Immigrants | India | 99.3 /100 | #79 | Exceptional 97.6% |
| Osage | 99.3 /100 | #80 | Exceptional 97.6% |
| Lumbee | 99.2 /100 | #81 | Exceptional 97.6% |
| Zimbabweans | 99.1 /100 | #82 | Exceptional 97.6% |
| Potawatomi | 99.1 /100 | #83 | Exceptional 97.6% |
| Shoshone | 99.0 /100 | #84 | Exceptional 97.6% |