Delaware vs Immigrants from Lithuania High School Diploma
COMPARE
Delaware
Immigrants from Lithuania
High School Diploma
High School Diploma Comparison
Delaware
Immigrants from Lithuania
89.2%
HIGH SCHOOL DIPLOMA
55.8/ 100
METRIC RATING
168th/ 347
METRIC RANK
91.3%
HIGH SCHOOL DIPLOMA
99.8/ 100
METRIC RATING
40th/ 347
METRIC RANK
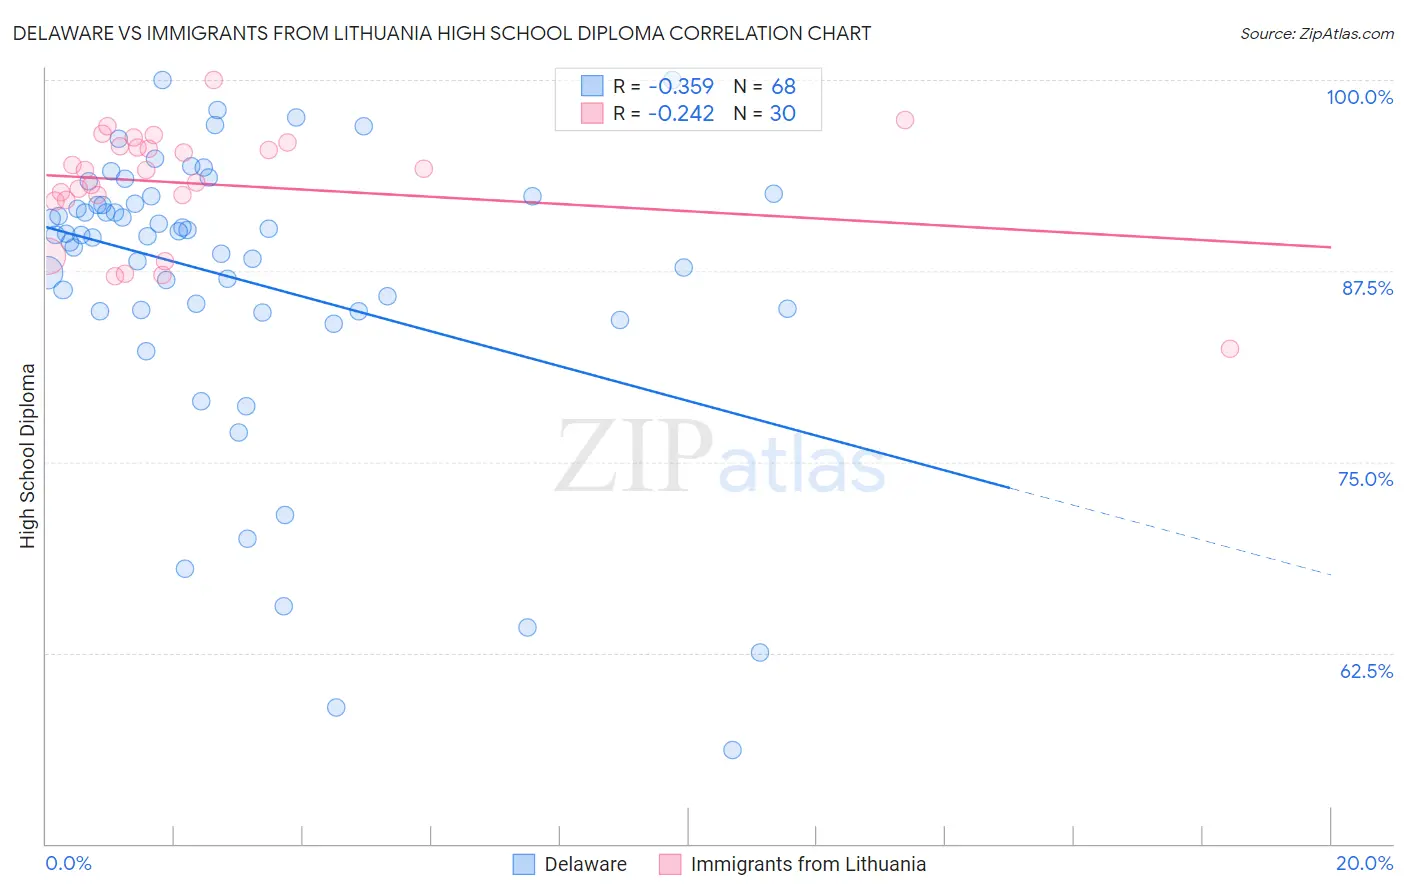
Delaware vs Immigrants from Lithuania High School Diploma Correlation Chart
The statistical analysis conducted on geographies consisting of 96,235,398 people shows a mild negative correlation between the proportion of Delaware and percentage of population with at least high school diploma education in the United States with a correlation coefficient (R) of -0.359 and weighted average of 89.2%. Similarly, the statistical analysis conducted on geographies consisting of 117,724,932 people shows a weak negative correlation between the proportion of Immigrants from Lithuania and percentage of population with at least high school diploma education in the United States with a correlation coefficient (R) of -0.242 and weighted average of 91.3%, a difference of 2.3%.
High School Diploma Correlation Summary
| Measurement | Delaware | Immigrants from Lithuania |
| Minimum | 56.1% | 82.4% |
| Maximum | 100.0% | 100.0% |
| Range | 43.9% | 17.6% |
| Mean | 86.9% | 93.2% |
| Median | 89.9% | 94.1% |
| Interquartile 25% (IQ1) | 84.9% | 92.2% |
| Interquartile 75% (IQ3) | 92.2% | 95.6% |
| Interquartile Range (IQR) | 7.2% | 3.4% |
| Standard Deviation (Sample) | 9.5% | 3.8% |
| Standard Deviation (Population) | 9.5% | 3.7% |
Similar Demographics by High School Diploma
Demographics Similar to Delaware by High School Diploma
In terms of high school diploma, the demographic groups most similar to Delaware are Iroquois (89.2%, a difference of 0.010%), Immigrants from Hong Kong (89.3%, a difference of 0.040%), Immigrants from Morocco (89.2%, a difference of 0.040%), Spanish (89.2%, a difference of 0.040%), and Immigrants from Asia (89.3%, a difference of 0.060%).
| Demographics | Rating | Rank | High School Diploma |
| Brazilians | 61.2 /100 | #161 | Good 89.3% |
| Bermudans | 61.1 /100 | #162 | Good 89.3% |
| Cree | 61.1 /100 | #163 | Good 89.3% |
| Immigrants | Nepal | 61.1 /100 | #164 | Good 89.3% |
| Immigrants | Asia | 59.8 /100 | #165 | Average 89.3% |
| Immigrants | Albania | 59.4 /100 | #166 | Average 89.3% |
| Immigrants | Hong Kong | 58.6 /100 | #167 | Average 89.3% |
| Delaware | 55.8 /100 | #168 | Average 89.2% |
| Iroquois | 55.1 /100 | #169 | Average 89.2% |
| Immigrants | Morocco | 53.3 /100 | #170 | Average 89.2% |
| Spanish | 52.9 /100 | #171 | Average 89.2% |
| Immigrants | Nonimmigrants | 51.8 /100 | #172 | Average 89.2% |
| Immigrants | Indonesia | 50.3 /100 | #173 | Average 89.1% |
| Hmong | 50.0 /100 | #174 | Average 89.1% |
| Immigrants | Western Asia | 49.0 /100 | #175 | Average 89.1% |
Demographics Similar to Immigrants from Lithuania by High School Diploma
In terms of high school diploma, the demographic groups most similar to Immigrants from Lithuania are Dutch (91.3%, a difference of 0.0%), Immigrants from Scotland (91.3%, a difference of 0.020%), Immigrants from Australia (91.3%, a difference of 0.020%), Northern European (91.3%, a difference of 0.030%), and Immigrants from Ireland (91.3%, a difference of 0.040%).
| Demographics | Rating | Rank | High School Diploma |
| Okinawans | 99.9 /100 | #33 | Exceptional 91.4% |
| Scottish | 99.9 /100 | #34 | Exceptional 91.4% |
| Irish | 99.9 /100 | #35 | Exceptional 91.4% |
| Tsimshian | 99.9 /100 | #36 | Exceptional 91.3% |
| Immigrants | Ireland | 99.9 /100 | #37 | Exceptional 91.3% |
| Immigrants | Scotland | 99.8 /100 | #38 | Exceptional 91.3% |
| Dutch | 99.8 /100 | #39 | Exceptional 91.3% |
| Immigrants | Lithuania | 99.8 /100 | #40 | Exceptional 91.3% |
| Immigrants | Australia | 99.8 /100 | #41 | Exceptional 91.3% |
| Northern Europeans | 99.8 /100 | #42 | Exceptional 91.3% |
| British | 99.8 /100 | #43 | Exceptional 91.3% |
| Immigrants | Austria | 99.8 /100 | #44 | Exceptional 91.3% |
| Turks | 99.8 /100 | #45 | Exceptional 91.2% |
| Greeks | 99.8 /100 | #46 | Exceptional 91.2% |
| Australians | 99.8 /100 | #47 | Exceptional 91.2% |