Nigerian vs Tohono O'odham High School Diploma
COMPARE
Nigerian
Tohono O'odham
High School Diploma
High School Diploma Comparison
Nigerians
Tohono O'odham
88.2%
HIGH SCHOOL DIPLOMA
5.2/ 100
METRIC RATING
229th/ 347
METRIC RANK
82.1%
HIGH SCHOOL DIPLOMA
0.0/ 100
METRIC RATING
334th/ 347
METRIC RANK
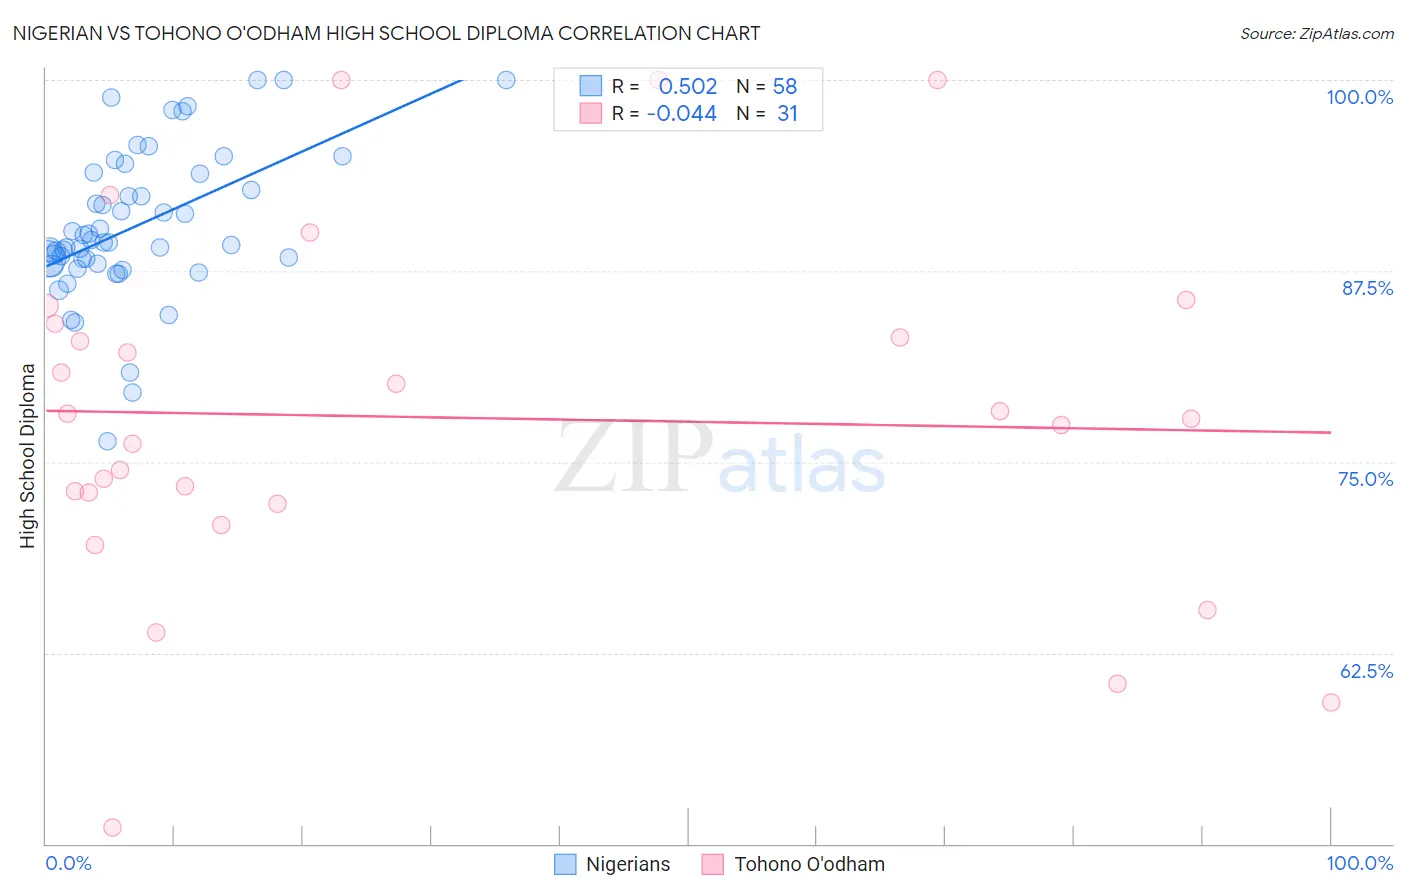
Nigerian vs Tohono O'odham High School Diploma Correlation Chart
The statistical analysis conducted on geographies consisting of 332,724,627 people shows a substantial positive correlation between the proportion of Nigerians and percentage of population with at least high school diploma education in the United States with a correlation coefficient (R) of 0.502 and weighted average of 88.2%. Similarly, the statistical analysis conducted on geographies consisting of 58,730,615 people shows no correlation between the proportion of Tohono O'odham and percentage of population with at least high school diploma education in the United States with a correlation coefficient (R) of -0.044 and weighted average of 82.1%, a difference of 7.5%.
High School Diploma Correlation Summary
| Measurement | Nigerian | Tohono O'odham |
| Minimum | 76.3% | 51.1% |
| Maximum | 100.0% | 100.0% |
| Range | 23.7% | 48.9% |
| Mean | 90.4% | 77.9% |
| Median | 89.4% | 77.9% |
| Interquartile 25% (IQ1) | 88.0% | 72.3% |
| Interquartile 75% (IQ3) | 93.9% | 84.1% |
| Interquartile Range (IQR) | 5.9% | 11.8% |
| Standard Deviation (Sample) | 4.9% | 11.6% |
| Standard Deviation (Population) | 4.8% | 11.4% |
Similar Demographics by High School Diploma
Demographics Similar to Nigerians by High School Diploma
In terms of high school diploma, the demographic groups most similar to Nigerians are Kiowa (88.2%, a difference of 0.010%), Immigrants from Liberia (88.2%, a difference of 0.020%), Uruguayan (88.2%, a difference of 0.030%), Blackfeet (88.1%, a difference of 0.080%), and Creek (88.3%, a difference of 0.11%).
| Demographics | Rating | Rank | High School Diploma |
| Colville | 7.8 /100 | #222 | Tragic 88.3% |
| Immigrants | Zaire | 7.6 /100 | #223 | Tragic 88.3% |
| Shoshone | 7.0 /100 | #224 | Tragic 88.3% |
| Creek | 6.9 /100 | #225 | Tragic 88.3% |
| Uruguayans | 5.6 /100 | #226 | Tragic 88.2% |
| Immigrants | Liberia | 5.5 /100 | #227 | Tragic 88.2% |
| Kiowa | 5.3 /100 | #228 | Tragic 88.2% |
| Nigerians | 5.2 /100 | #229 | Tragic 88.2% |
| Blackfeet | 4.2 /100 | #230 | Tragic 88.1% |
| Colombians | 3.8 /100 | #231 | Tragic 88.1% |
| Immigrants | Middle Africa | 3.4 /100 | #232 | Tragic 88.0% |
| Immigrants | Panama | 3.1 /100 | #233 | Tragic 88.0% |
| Immigrants | Thailand | 3.1 /100 | #234 | Tragic 88.0% |
| Immigrants | Bahamas | 2.9 /100 | #235 | Tragic 88.0% |
| Sub-Saharan Africans | 2.8 /100 | #236 | Tragic 87.9% |
Demographics Similar to Tohono O'odham by High School Diploma
In terms of high school diploma, the demographic groups most similar to Tohono O'odham are Immigrants from Latin America (82.1%, a difference of 0.11%), Guatemalan (82.0%, a difference of 0.11%), Immigrants from Dominican Republic (82.0%, a difference of 0.12%), Immigrants from Yemen (81.8%, a difference of 0.27%), and Salvadoran (81.7%, a difference of 0.44%).
| Demographics | Rating | Rank | High School Diploma |
| Hondurans | 0.0 /100 | #327 | Tragic 83.0% |
| Dominicans | 0.0 /100 | #328 | Tragic 82.9% |
| Hispanics or Latinos | 0.0 /100 | #329 | Tragic 82.9% |
| Immigrants | Azores | 0.0 /100 | #330 | Tragic 82.8% |
| Central Americans | 0.0 /100 | #331 | Tragic 82.5% |
| Immigrants | Honduras | 0.0 /100 | #332 | Tragic 82.5% |
| Immigrants | Latin America | 0.0 /100 | #333 | Tragic 82.1% |
| Tohono O'odham | 0.0 /100 | #334 | Tragic 82.1% |
| Guatemalans | 0.0 /100 | #335 | Tragic 82.0% |
| Immigrants | Dominican Republic | 0.0 /100 | #336 | Tragic 82.0% |
| Immigrants | Yemen | 0.0 /100 | #337 | Tragic 81.8% |
| Salvadorans | 0.0 /100 | #338 | Tragic 81.7% |
| Pima | 0.0 /100 | #339 | Tragic 81.6% |
| Houma | 0.0 /100 | #340 | Tragic 81.5% |
| Mexicans | 0.0 /100 | #341 | Tragic 81.4% |