Nigerian vs Immigrants from Asia High School Diploma
COMPARE
Nigerian
Immigrants from Asia
High School Diploma
High School Diploma Comparison
Nigerians
Immigrants from Asia
88.2%
HIGH SCHOOL DIPLOMA
5.2/ 100
METRIC RATING
229th/ 347
METRIC RANK
89.3%
HIGH SCHOOL DIPLOMA
59.8/ 100
METRIC RATING
165th/ 347
METRIC RANK
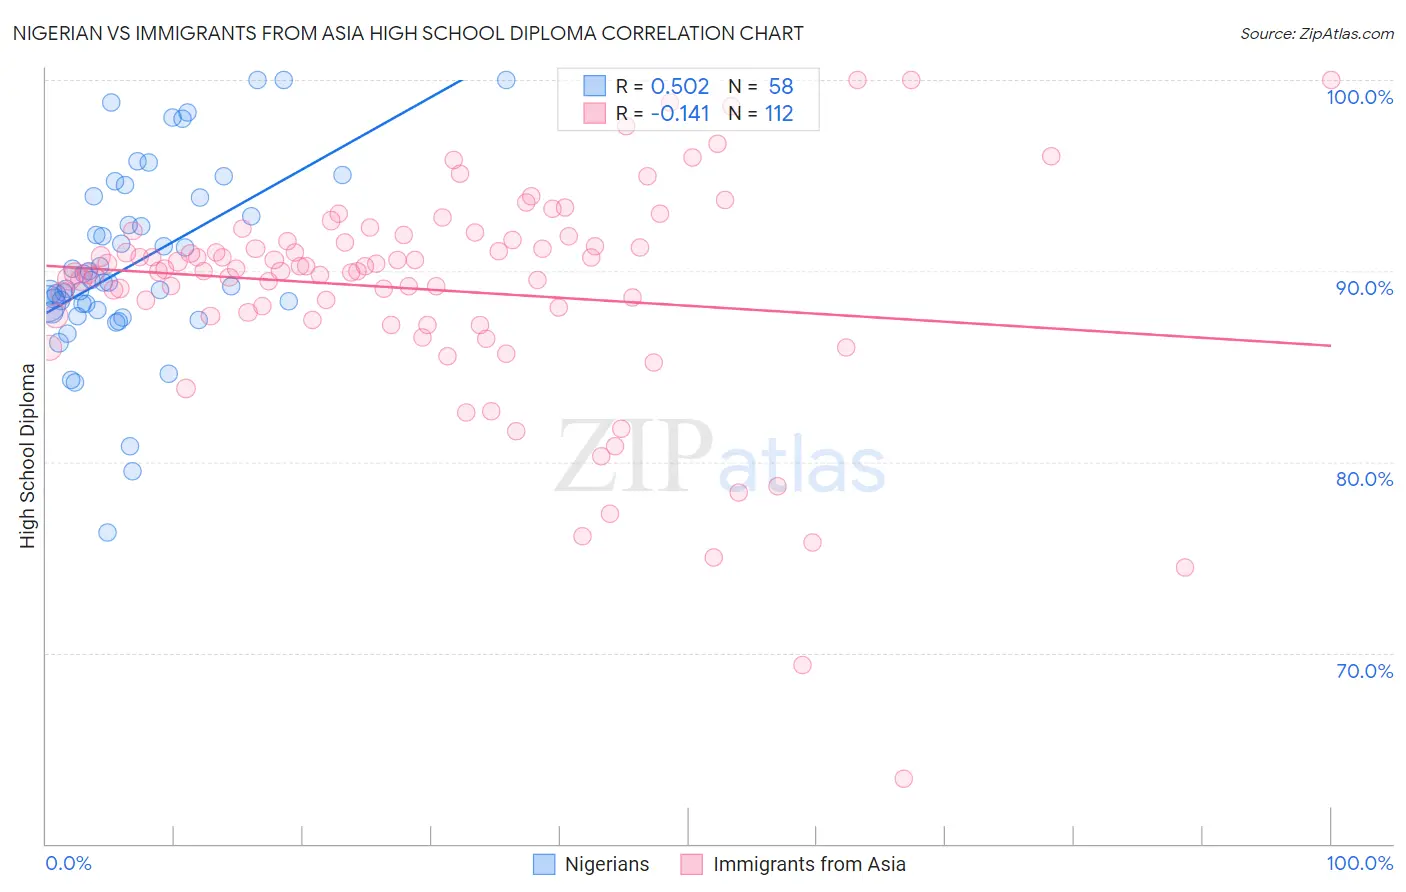
Nigerian vs Immigrants from Asia High School Diploma Correlation Chart
The statistical analysis conducted on geographies consisting of 332,724,627 people shows a substantial positive correlation between the proportion of Nigerians and percentage of population with at least high school diploma education in the United States with a correlation coefficient (R) of 0.502 and weighted average of 88.2%. Similarly, the statistical analysis conducted on geographies consisting of 549,170,250 people shows a poor negative correlation between the proportion of Immigrants from Asia and percentage of population with at least high school diploma education in the United States with a correlation coefficient (R) of -0.141 and weighted average of 89.3%, a difference of 1.3%.
High School Diploma Correlation Summary
| Measurement | Nigerian | Immigrants from Asia |
| Minimum | 76.3% | 63.4% |
| Maximum | 100.0% | 100.0% |
| Range | 23.7% | 36.6% |
| Mean | 90.4% | 89.0% |
| Median | 89.4% | 90.1% |
| Interquartile 25% (IQ1) | 88.0% | 87.7% |
| Interquartile 75% (IQ3) | 93.9% | 91.6% |
| Interquartile Range (IQR) | 5.9% | 3.9% |
| Standard Deviation (Sample) | 4.9% | 5.9% |
| Standard Deviation (Population) | 4.8% | 5.8% |
Similar Demographics by High School Diploma
Demographics Similar to Nigerians by High School Diploma
In terms of high school diploma, the demographic groups most similar to Nigerians are Kiowa (88.2%, a difference of 0.010%), Immigrants from Liberia (88.2%, a difference of 0.020%), Uruguayan (88.2%, a difference of 0.030%), Blackfeet (88.1%, a difference of 0.080%), and Creek (88.3%, a difference of 0.11%).
| Demographics | Rating | Rank | High School Diploma |
| Colville | 7.8 /100 | #222 | Tragic 88.3% |
| Immigrants | Zaire | 7.6 /100 | #223 | Tragic 88.3% |
| Shoshone | 7.0 /100 | #224 | Tragic 88.3% |
| Creek | 6.9 /100 | #225 | Tragic 88.3% |
| Uruguayans | 5.6 /100 | #226 | Tragic 88.2% |
| Immigrants | Liberia | 5.5 /100 | #227 | Tragic 88.2% |
| Kiowa | 5.3 /100 | #228 | Tragic 88.2% |
| Nigerians | 5.2 /100 | #229 | Tragic 88.2% |
| Blackfeet | 4.2 /100 | #230 | Tragic 88.1% |
| Colombians | 3.8 /100 | #231 | Tragic 88.1% |
| Immigrants | Middle Africa | 3.4 /100 | #232 | Tragic 88.0% |
| Immigrants | Panama | 3.1 /100 | #233 | Tragic 88.0% |
| Immigrants | Thailand | 3.1 /100 | #234 | Tragic 88.0% |
| Immigrants | Bahamas | 2.9 /100 | #235 | Tragic 88.0% |
| Sub-Saharan Africans | 2.8 /100 | #236 | Tragic 87.9% |
Demographics Similar to Immigrants from Asia by High School Diploma
In terms of high school diploma, the demographic groups most similar to Immigrants from Asia are Immigrants from Albania (89.3%, a difference of 0.010%), Brazilian (89.3%, a difference of 0.020%), Bermudan (89.3%, a difference of 0.020%), Cree (89.3%, a difference of 0.020%), and Immigrants from Nepal (89.3%, a difference of 0.020%).
| Demographics | Rating | Rank | High School Diploma |
| Immigrants | Pakistan | 62.5 /100 | #158 | Good 89.3% |
| Immigrants | China | 62.0 /100 | #159 | Good 89.3% |
| Laotians | 61.8 /100 | #160 | Good 89.3% |
| Brazilians | 61.2 /100 | #161 | Good 89.3% |
| Bermudans | 61.1 /100 | #162 | Good 89.3% |
| Cree | 61.1 /100 | #163 | Good 89.3% |
| Immigrants | Nepal | 61.1 /100 | #164 | Good 89.3% |
| Immigrants | Asia | 59.8 /100 | #165 | Average 89.3% |
| Immigrants | Albania | 59.4 /100 | #166 | Average 89.3% |
| Immigrants | Hong Kong | 58.6 /100 | #167 | Average 89.3% |
| Delaware | 55.8 /100 | #168 | Average 89.2% |
| Iroquois | 55.1 /100 | #169 | Average 89.2% |
| Immigrants | Morocco | 53.3 /100 | #170 | Average 89.2% |
| Spanish | 52.9 /100 | #171 | Average 89.2% |
| Immigrants | Nonimmigrants | 51.8 /100 | #172 | Average 89.2% |