Nicaraguan vs Trinidadian and Tobagonian 8th Grade
COMPARE
Nicaraguan
Trinidadian and Tobagonian
8th Grade
8th Grade Comparison
Nicaraguans
Trinidadians and Tobagonians
93.0%
8TH GRADE
0.0/ 100
METRIC RATING
322nd/ 347
METRIC RANK
94.7%
8TH GRADE
0.2/ 100
METRIC RATING
274th/ 347
METRIC RANK
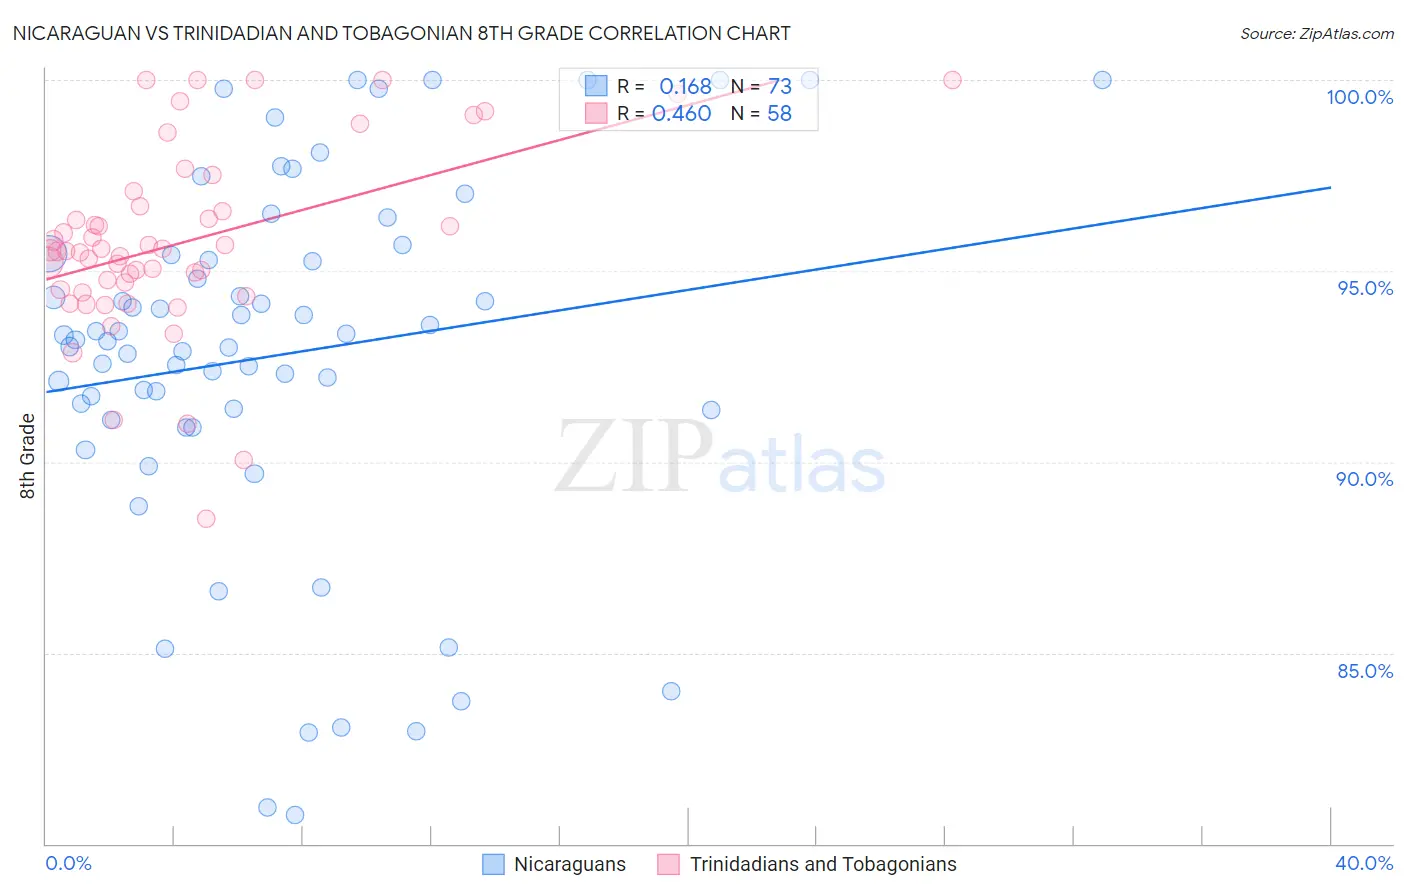
Nicaraguan vs Trinidadian and Tobagonian 8th Grade Correlation Chart
The statistical analysis conducted on geographies consisting of 285,711,651 people shows a poor positive correlation between the proportion of Nicaraguans and percentage of population with at least 8th grade education in the United States with a correlation coefficient (R) of 0.168 and weighted average of 93.0%. Similarly, the statistical analysis conducted on geographies consisting of 219,881,170 people shows a moderate positive correlation between the proportion of Trinidadians and Tobagonians and percentage of population with at least 8th grade education in the United States with a correlation coefficient (R) of 0.460 and weighted average of 94.7%, a difference of 1.9%.
8th Grade Correlation Summary
| Measurement | Nicaraguan | Trinidadian and Tobagonian |
| Minimum | 80.8% | 88.5% |
| Maximum | 100.0% | 100.0% |
| Range | 19.2% | 11.5% |
| Mean | 92.8% | 95.8% |
| Median | 93.2% | 95.5% |
| Interquartile 25% (IQ1) | 91.2% | 94.5% |
| Interquartile 75% (IQ3) | 95.4% | 96.7% |
| Interquartile Range (IQR) | 4.2% | 2.2% |
| Standard Deviation (Sample) | 4.8% | 2.5% |
| Standard Deviation (Population) | 4.7% | 2.4% |
Similar Demographics by 8th Grade
Demographics Similar to Nicaraguans by 8th Grade
In terms of 8th grade, the demographic groups most similar to Nicaraguans are Immigrants from Belize (92.9%, a difference of 0.050%), Belizean (93.1%, a difference of 0.12%), Nepalese (92.8%, a difference of 0.12%), Dominican (92.8%, a difference of 0.22%), and Immigrants from Fiji (93.2%, a difference of 0.25%).
| Demographics | Rating | Rank | 8th Grade |
| Vietnamese | 0.0 /100 | #315 | Tragic 93.5% |
| Immigrants | Cambodia | 0.0 /100 | #316 | Tragic 93.3% |
| Immigrants | Ecuador | 0.0 /100 | #317 | Tragic 93.3% |
| Puerto Ricans | 0.0 /100 | #318 | Tragic 93.2% |
| Immigrants | Cuba | 0.0 /100 | #319 | Tragic 93.2% |
| Immigrants | Fiji | 0.0 /100 | #320 | Tragic 93.2% |
| Belizeans | 0.0 /100 | #321 | Tragic 93.1% |
| Nicaraguans | 0.0 /100 | #322 | Tragic 93.0% |
| Immigrants | Belize | 0.0 /100 | #323 | Tragic 92.9% |
| Nepalese | 0.0 /100 | #324 | Tragic 92.8% |
| Dominicans | 0.0 /100 | #325 | Tragic 92.8% |
| Central American Indians | 0.0 /100 | #326 | Tragic 92.7% |
| Immigrants | Azores | 0.0 /100 | #327 | Tragic 92.5% |
| Immigrants | Nicaragua | 0.0 /100 | #328 | Tragic 92.5% |
| Immigrants | Cabo Verde | 0.0 /100 | #329 | Tragic 92.4% |
Demographics Similar to Trinidadians and Tobagonians by 8th Grade
In terms of 8th grade, the demographic groups most similar to Trinidadians and Tobagonians are Immigrants from Western Africa (94.8%, a difference of 0.010%), Immigrants from Colombia (94.7%, a difference of 0.010%), Immigrants from South America (94.8%, a difference of 0.020%), Immigrants from Uzbekistan (94.8%, a difference of 0.030%), and Immigrants from Afghanistan (94.8%, a difference of 0.030%).
| Demographics | Rating | Rank | 8th Grade |
| Immigrants | Ghana | 0.3 /100 | #267 | Tragic 94.8% |
| Immigrants | Uruguay | 0.3 /100 | #268 | Tragic 94.8% |
| Immigrants | Thailand | 0.2 /100 | #269 | Tragic 94.8% |
| Immigrants | Uzbekistan | 0.2 /100 | #270 | Tragic 94.8% |
| Immigrants | Afghanistan | 0.2 /100 | #271 | Tragic 94.8% |
| Immigrants | South America | 0.2 /100 | #272 | Tragic 94.8% |
| Immigrants | Western Africa | 0.2 /100 | #273 | Tragic 94.8% |
| Trinidadians and Tobagonians | 0.2 /100 | #274 | Tragic 94.7% |
| Immigrants | Colombia | 0.2 /100 | #275 | Tragic 94.7% |
| Peruvians | 0.1 /100 | #276 | Tragic 94.7% |
| Taiwanese | 0.1 /100 | #277 | Tragic 94.7% |
| Armenians | 0.1 /100 | #278 | Tragic 94.7% |
| Immigrants | Trinidad and Tobago | 0.1 /100 | #279 | Tragic 94.6% |
| Barbadians | 0.1 /100 | #280 | Tragic 94.6% |
| Immigrants | Bolivia | 0.1 /100 | #281 | Tragic 94.6% |