Immigrants from Kuwait vs Trinidadian and Tobagonian 8th Grade
COMPARE
Immigrants from Kuwait
Trinidadian and Tobagonian
8th Grade
8th Grade Comparison
Immigrants from Kuwait
Trinidadians and Tobagonians
96.1%
8TH GRADE
92.2/ 100
METRIC RATING
132nd/ 347
METRIC RANK
94.7%
8TH GRADE
0.2/ 100
METRIC RATING
274th/ 347
METRIC RANK
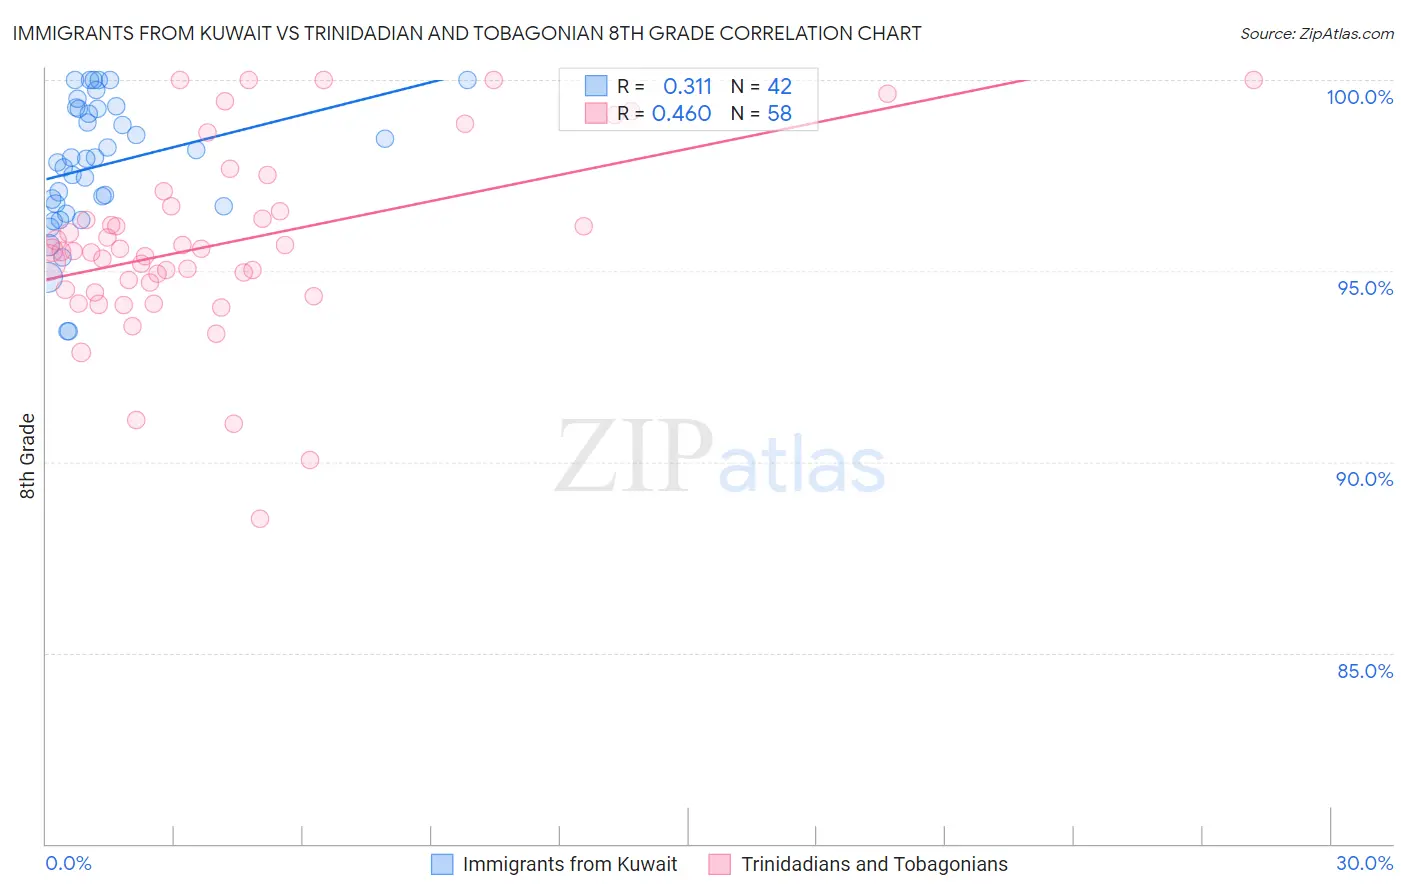
Immigrants from Kuwait vs Trinidadian and Tobagonian 8th Grade Correlation Chart
The statistical analysis conducted on geographies consisting of 136,913,666 people shows a mild positive correlation between the proportion of Immigrants from Kuwait and percentage of population with at least 8th grade education in the United States with a correlation coefficient (R) of 0.311 and weighted average of 96.1%. Similarly, the statistical analysis conducted on geographies consisting of 219,881,170 people shows a moderate positive correlation between the proportion of Trinidadians and Tobagonians and percentage of population with at least 8th grade education in the United States with a correlation coefficient (R) of 0.460 and weighted average of 94.7%, a difference of 1.5%.
8th Grade Correlation Summary
| Measurement | Immigrants from Kuwait | Trinidadian and Tobagonian |
| Minimum | 93.4% | 88.5% |
| Maximum | 100.0% | 100.0% |
| Range | 6.6% | 11.5% |
| Mean | 97.8% | 95.8% |
| Median | 98.0% | 95.5% |
| Interquartile 25% (IQ1) | 96.7% | 94.5% |
| Interquartile 75% (IQ3) | 99.2% | 96.7% |
| Interquartile Range (IQR) | 2.6% | 2.2% |
| Standard Deviation (Sample) | 1.7% | 2.5% |
| Standard Deviation (Population) | 1.7% | 2.4% |
Similar Demographics by 8th Grade
Demographics Similar to Immigrants from Kuwait by 8th Grade
In terms of 8th grade, the demographic groups most similar to Immigrants from Kuwait are Pueblo (96.1%, a difference of 0.0%), Soviet Union (96.1%, a difference of 0.010%), Immigrants from Turkey (96.1%, a difference of 0.010%), Immigrants from Hungary (96.1%, a difference of 0.010%), and Basque (96.1%, a difference of 0.010%).
| Demographics | Rating | Rank | 8th Grade |
| Immigrants | Romania | 94.1 /100 | #125 | Exceptional 96.2% |
| Choctaw | 94.0 /100 | #126 | Exceptional 96.2% |
| Immigrants | Serbia | 94.0 /100 | #127 | Exceptional 96.2% |
| Immigrants | Bosnia and Herzegovina | 93.9 /100 | #128 | Exceptional 96.2% |
| Cheyenne | 93.3 /100 | #129 | Exceptional 96.1% |
| Soviet Union | 92.6 /100 | #130 | Exceptional 96.1% |
| Pueblo | 92.3 /100 | #131 | Exceptional 96.1% |
| Immigrants | Kuwait | 92.2 /100 | #132 | Exceptional 96.1% |
| Immigrants | Turkey | 91.7 /100 | #133 | Exceptional 96.1% |
| Immigrants | Hungary | 91.5 /100 | #134 | Exceptional 96.1% |
| Basques | 91.5 /100 | #135 | Exceptional 96.1% |
| Jordanians | 91.3 /100 | #136 | Exceptional 96.1% |
| Cambodians | 90.6 /100 | #137 | Exceptional 96.1% |
| Burmese | 90.2 /100 | #138 | Exceptional 96.1% |
| Hmong | 89.7 /100 | #139 | Excellent 96.1% |
Demographics Similar to Trinidadians and Tobagonians by 8th Grade
In terms of 8th grade, the demographic groups most similar to Trinidadians and Tobagonians are Immigrants from Western Africa (94.8%, a difference of 0.010%), Immigrants from Colombia (94.7%, a difference of 0.010%), Immigrants from South America (94.8%, a difference of 0.020%), Immigrants from Uzbekistan (94.8%, a difference of 0.030%), and Immigrants from Afghanistan (94.8%, a difference of 0.030%).
| Demographics | Rating | Rank | 8th Grade |
| Immigrants | Ghana | 0.3 /100 | #267 | Tragic 94.8% |
| Immigrants | Uruguay | 0.3 /100 | #268 | Tragic 94.8% |
| Immigrants | Thailand | 0.2 /100 | #269 | Tragic 94.8% |
| Immigrants | Uzbekistan | 0.2 /100 | #270 | Tragic 94.8% |
| Immigrants | Afghanistan | 0.2 /100 | #271 | Tragic 94.8% |
| Immigrants | South America | 0.2 /100 | #272 | Tragic 94.8% |
| Immigrants | Western Africa | 0.2 /100 | #273 | Tragic 94.8% |
| Trinidadians and Tobagonians | 0.2 /100 | #274 | Tragic 94.7% |
| Immigrants | Colombia | 0.2 /100 | #275 | Tragic 94.7% |
| Peruvians | 0.1 /100 | #276 | Tragic 94.7% |
| Taiwanese | 0.1 /100 | #277 | Tragic 94.7% |
| Armenians | 0.1 /100 | #278 | Tragic 94.7% |
| Immigrants | Trinidad and Tobago | 0.1 /100 | #279 | Tragic 94.6% |
| Barbadians | 0.1 /100 | #280 | Tragic 94.6% |
| Immigrants | Bolivia | 0.1 /100 | #281 | Tragic 94.6% |