Soviet Union vs Trinidadian and Tobagonian 8th Grade
COMPARE
Soviet Union
Trinidadian and Tobagonian
8th Grade
8th Grade Comparison
Soviet Union
Trinidadians and Tobagonians
96.1%
8TH GRADE
92.6/ 100
METRIC RATING
130th/ 347
METRIC RANK
94.7%
8TH GRADE
0.2/ 100
METRIC RATING
274th/ 347
METRIC RANK
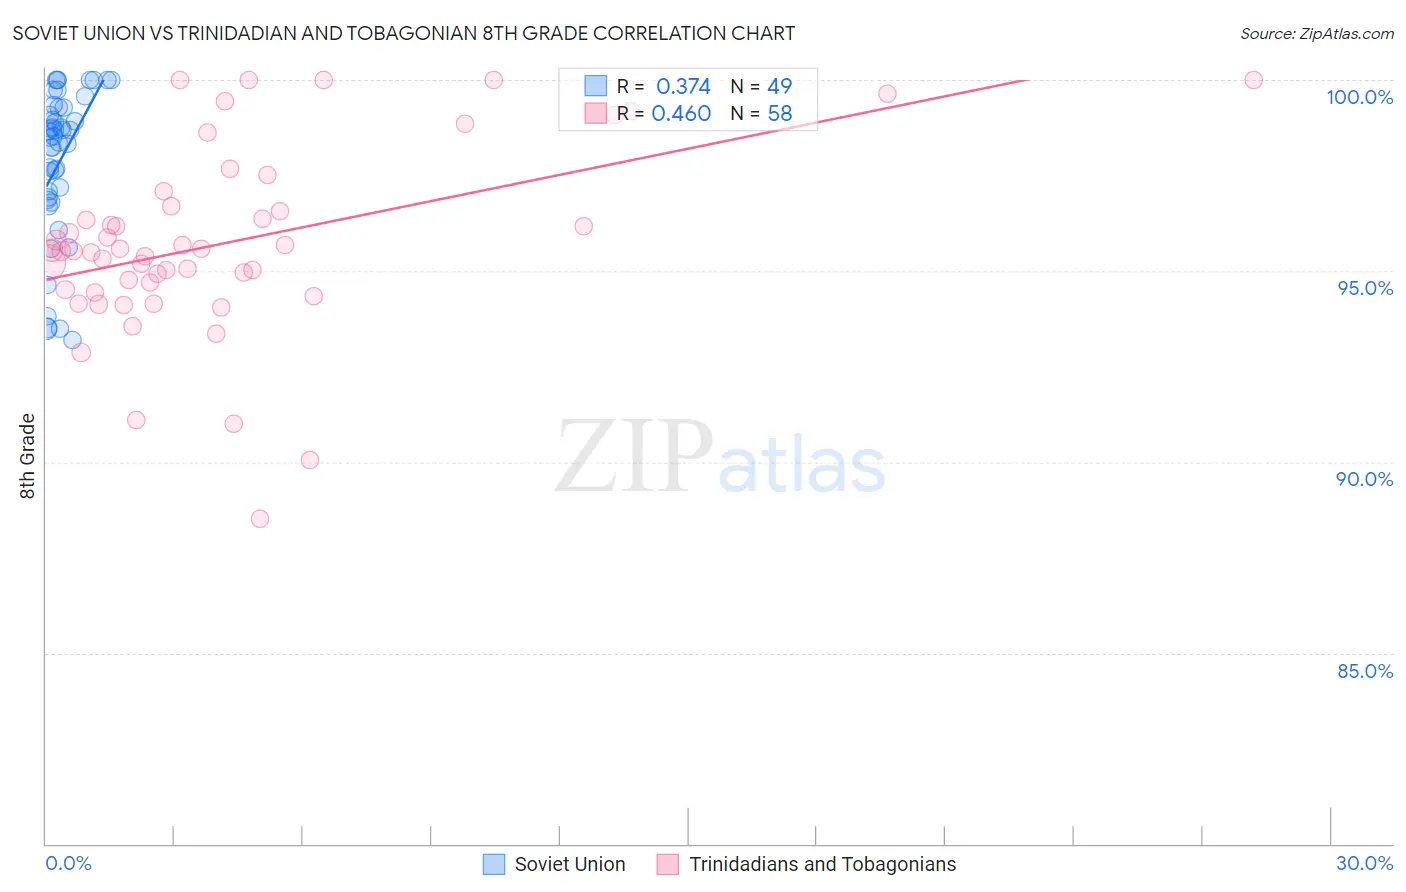
Soviet Union vs Trinidadian and Tobagonian 8th Grade Correlation Chart
The statistical analysis conducted on geographies consisting of 43,454,395 people shows a mild positive correlation between the proportion of Soviet Union and percentage of population with at least 8th grade education in the United States with a correlation coefficient (R) of 0.374 and weighted average of 96.1%. Similarly, the statistical analysis conducted on geographies consisting of 219,881,170 people shows a moderate positive correlation between the proportion of Trinidadians and Tobagonians and percentage of population with at least 8th grade education in the United States with a correlation coefficient (R) of 0.460 and weighted average of 94.7%, a difference of 1.5%.
8th Grade Correlation Summary
| Measurement | Soviet Union | Trinidadian and Tobagonian |
| Minimum | 93.2% | 88.5% |
| Maximum | 100.0% | 100.0% |
| Range | 6.8% | 11.5% |
| Mean | 97.9% | 95.8% |
| Median | 98.5% | 95.5% |
| Interquartile 25% (IQ1) | 96.9% | 94.5% |
| Interquartile 75% (IQ3) | 99.3% | 96.7% |
| Interquartile Range (IQR) | 2.4% | 2.2% |
| Standard Deviation (Sample) | 2.0% | 2.5% |
| Standard Deviation (Population) | 1.9% | 2.4% |
Similar Demographics by 8th Grade
Demographics Similar to Soviet Union by 8th Grade
In terms of 8th grade, the demographic groups most similar to Soviet Union are Pueblo (96.1%, a difference of 0.010%), Immigrants from Kuwait (96.1%, a difference of 0.010%), Cheyenne (96.1%, a difference of 0.020%), Immigrants from Turkey (96.1%, a difference of 0.020%), and Immigrants from Hungary (96.1%, a difference of 0.020%).
| Demographics | Rating | Rank | 8th Grade |
| Filipinos | 94.6 /100 | #123 | Exceptional 96.2% |
| Palestinians | 94.6 /100 | #124 | Exceptional 96.2% |
| Immigrants | Romania | 94.1 /100 | #125 | Exceptional 96.2% |
| Choctaw | 94.0 /100 | #126 | Exceptional 96.2% |
| Immigrants | Serbia | 94.0 /100 | #127 | Exceptional 96.2% |
| Immigrants | Bosnia and Herzegovina | 93.9 /100 | #128 | Exceptional 96.2% |
| Cheyenne | 93.3 /100 | #129 | Exceptional 96.1% |
| Soviet Union | 92.6 /100 | #130 | Exceptional 96.1% |
| Pueblo | 92.3 /100 | #131 | Exceptional 96.1% |
| Immigrants | Kuwait | 92.2 /100 | #132 | Exceptional 96.1% |
| Immigrants | Turkey | 91.7 /100 | #133 | Exceptional 96.1% |
| Immigrants | Hungary | 91.5 /100 | #134 | Exceptional 96.1% |
| Basques | 91.5 /100 | #135 | Exceptional 96.1% |
| Jordanians | 91.3 /100 | #136 | Exceptional 96.1% |
| Cambodians | 90.6 /100 | #137 | Exceptional 96.1% |
Demographics Similar to Trinidadians and Tobagonians by 8th Grade
In terms of 8th grade, the demographic groups most similar to Trinidadians and Tobagonians are Immigrants from Western Africa (94.8%, a difference of 0.010%), Immigrants from Colombia (94.7%, a difference of 0.010%), Immigrants from South America (94.8%, a difference of 0.020%), Immigrants from Uzbekistan (94.8%, a difference of 0.030%), and Immigrants from Afghanistan (94.8%, a difference of 0.030%).
| Demographics | Rating | Rank | 8th Grade |
| Immigrants | Ghana | 0.3 /100 | #267 | Tragic 94.8% |
| Immigrants | Uruguay | 0.3 /100 | #268 | Tragic 94.8% |
| Immigrants | Thailand | 0.2 /100 | #269 | Tragic 94.8% |
| Immigrants | Uzbekistan | 0.2 /100 | #270 | Tragic 94.8% |
| Immigrants | Afghanistan | 0.2 /100 | #271 | Tragic 94.8% |
| Immigrants | South America | 0.2 /100 | #272 | Tragic 94.8% |
| Immigrants | Western Africa | 0.2 /100 | #273 | Tragic 94.8% |
| Trinidadians and Tobagonians | 0.2 /100 | #274 | Tragic 94.7% |
| Immigrants | Colombia | 0.2 /100 | #275 | Tragic 94.7% |
| Peruvians | 0.1 /100 | #276 | Tragic 94.7% |
| Taiwanese | 0.1 /100 | #277 | Tragic 94.7% |
| Armenians | 0.1 /100 | #278 | Tragic 94.7% |
| Immigrants | Trinidad and Tobago | 0.1 /100 | #279 | Tragic 94.6% |
| Barbadians | 0.1 /100 | #280 | Tragic 94.6% |
| Immigrants | Bolivia | 0.1 /100 | #281 | Tragic 94.6% |