Nicaraguan vs Alaska Native 8th Grade
COMPARE
Nicaraguan
Alaska Native
8th Grade
8th Grade Comparison
Nicaraguans
Alaska Natives
93.0%
8TH GRADE
0.0/ 100
METRIC RATING
322nd/ 347
METRIC RANK
97.0%
8TH GRADE
100.0/ 100
METRIC RATING
35th/ 347
METRIC RANK
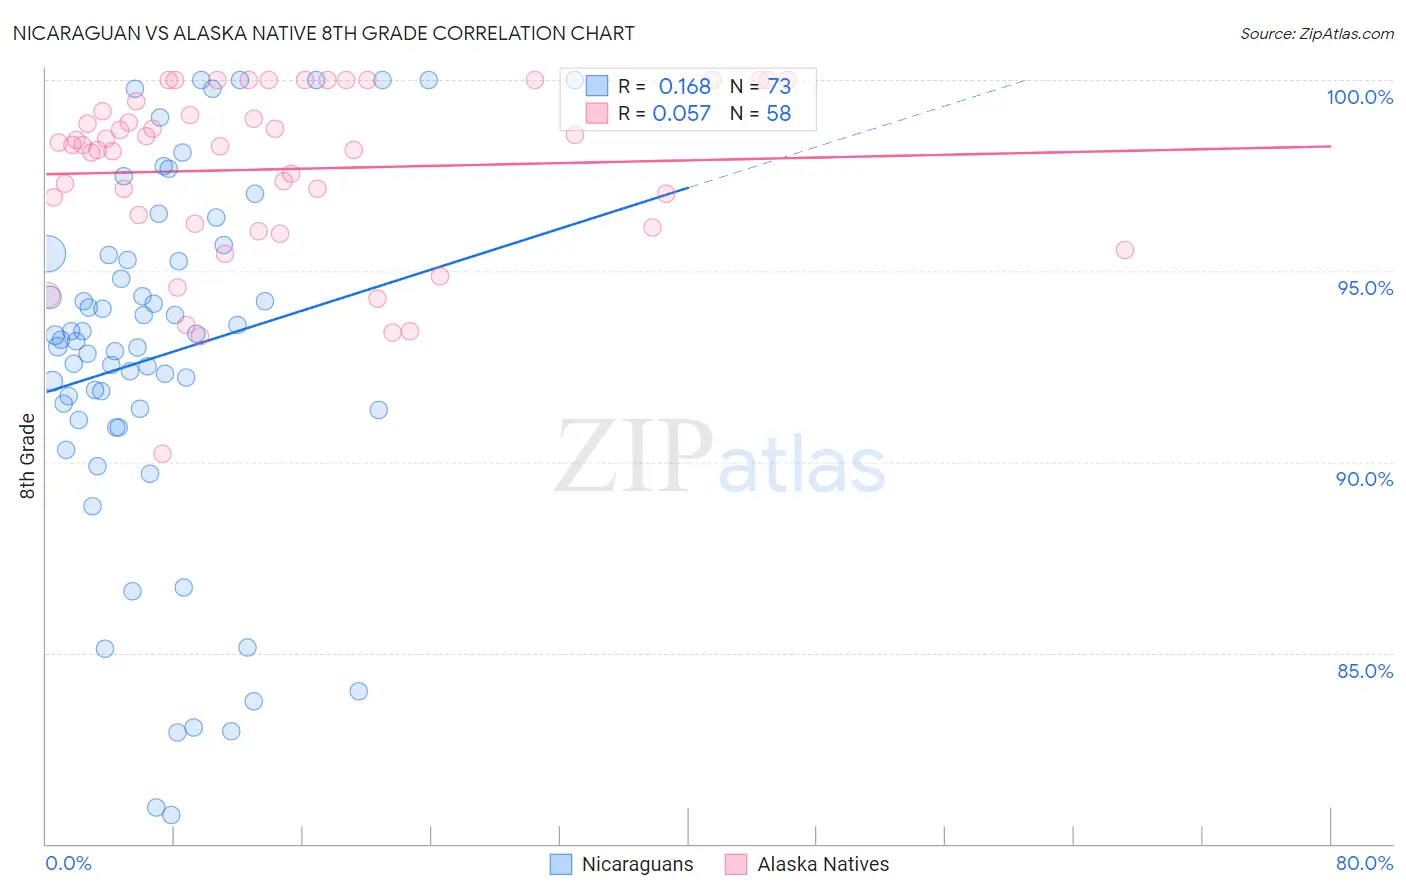
Nicaraguan vs Alaska Native 8th Grade Correlation Chart
The statistical analysis conducted on geographies consisting of 285,711,651 people shows a poor positive correlation between the proportion of Nicaraguans and percentage of population with at least 8th grade education in the United States with a correlation coefficient (R) of 0.168 and weighted average of 93.0%. Similarly, the statistical analysis conducted on geographies consisting of 76,778,057 people shows a slight positive correlation between the proportion of Alaska Natives and percentage of population with at least 8th grade education in the United States with a correlation coefficient (R) of 0.057 and weighted average of 97.0%, a difference of 4.3%.
8th Grade Correlation Summary
| Measurement | Nicaraguan | Alaska Native |
| Minimum | 80.8% | 90.2% |
| Maximum | 100.0% | 100.0% |
| Range | 19.2% | 9.8% |
| Mean | 92.8% | 97.7% |
| Median | 93.2% | 98.3% |
| Interquartile 25% (IQ1) | 91.2% | 96.2% |
| Interquartile 75% (IQ3) | 95.4% | 99.4% |
| Interquartile Range (IQR) | 4.2% | 3.2% |
| Standard Deviation (Sample) | 4.8% | 2.2% |
| Standard Deviation (Population) | 4.7% | 2.2% |
Similar Demographics by 8th Grade
Demographics Similar to Nicaraguans by 8th Grade
In terms of 8th grade, the demographic groups most similar to Nicaraguans are Immigrants from Belize (92.9%, a difference of 0.050%), Belizean (93.1%, a difference of 0.12%), Nepalese (92.8%, a difference of 0.12%), Dominican (92.8%, a difference of 0.22%), and Immigrants from Fiji (93.2%, a difference of 0.25%).
| Demographics | Rating | Rank | 8th Grade |
| Vietnamese | 0.0 /100 | #315 | Tragic 93.5% |
| Immigrants | Cambodia | 0.0 /100 | #316 | Tragic 93.3% |
| Immigrants | Ecuador | 0.0 /100 | #317 | Tragic 93.3% |
| Puerto Ricans | 0.0 /100 | #318 | Tragic 93.2% |
| Immigrants | Cuba | 0.0 /100 | #319 | Tragic 93.2% |
| Immigrants | Fiji | 0.0 /100 | #320 | Tragic 93.2% |
| Belizeans | 0.0 /100 | #321 | Tragic 93.1% |
| Nicaraguans | 0.0 /100 | #322 | Tragic 93.0% |
| Immigrants | Belize | 0.0 /100 | #323 | Tragic 92.9% |
| Nepalese | 0.0 /100 | #324 | Tragic 92.8% |
| Dominicans | 0.0 /100 | #325 | Tragic 92.8% |
| Central American Indians | 0.0 /100 | #326 | Tragic 92.7% |
| Immigrants | Azores | 0.0 /100 | #327 | Tragic 92.5% |
| Immigrants | Nicaragua | 0.0 /100 | #328 | Tragic 92.5% |
| Immigrants | Cabo Verde | 0.0 /100 | #329 | Tragic 92.4% |
Demographics Similar to Alaska Natives by 8th Grade
In terms of 8th grade, the demographic groups most similar to Alaska Natives are Luxembourger (97.0%, a difference of 0.010%), Belgian (97.0%, a difference of 0.010%), Latvian (97.0%, a difference of 0.010%), British (97.0%, a difference of 0.030%), and Hungarian (97.0%, a difference of 0.030%).
| Demographics | Rating | Rank | 8th Grade |
| Italians | 100.0 /100 | #28 | Exceptional 97.1% |
| Europeans | 100.0 /100 | #29 | Exceptional 97.1% |
| Sioux | 100.0 /100 | #30 | Exceptional 97.1% |
| Chippewa | 100.0 /100 | #31 | Exceptional 97.1% |
| Yup'ik | 100.0 /100 | #32 | Exceptional 97.0% |
| Swiss | 100.0 /100 | #33 | Exceptional 97.0% |
| Luxembourgers | 100.0 /100 | #34 | Exceptional 97.0% |
| Alaska Natives | 100.0 /100 | #35 | Exceptional 97.0% |
| Belgians | 100.0 /100 | #36 | Exceptional 97.0% |
| Latvians | 100.0 /100 | #37 | Exceptional 97.0% |
| British | 100.0 /100 | #38 | Exceptional 97.0% |
| Hungarians | 100.0 /100 | #39 | Exceptional 97.0% |
| Inupiat | 100.0 /100 | #40 | Exceptional 97.0% |
| Eastern Europeans | 100.0 /100 | #41 | Exceptional 97.0% |
| Chinese | 100.0 /100 | #42 | Exceptional 96.9% |