Dutch West Indian vs Tlingit-Haida Associate's Degree
COMPARE
Dutch West Indian
Tlingit-Haida
Associate's Degree
Associate's Degree Comparison
Dutch West Indians
Tlingit-Haida
36.5%
ASSOCIATE'S DEGREE
0.0/ 100
METRIC RATING
327th/ 347
METRIC RANK
43.0%
ASSOCIATE'S DEGREE
2.1/ 100
METRIC RATING
234th/ 347
METRIC RANK
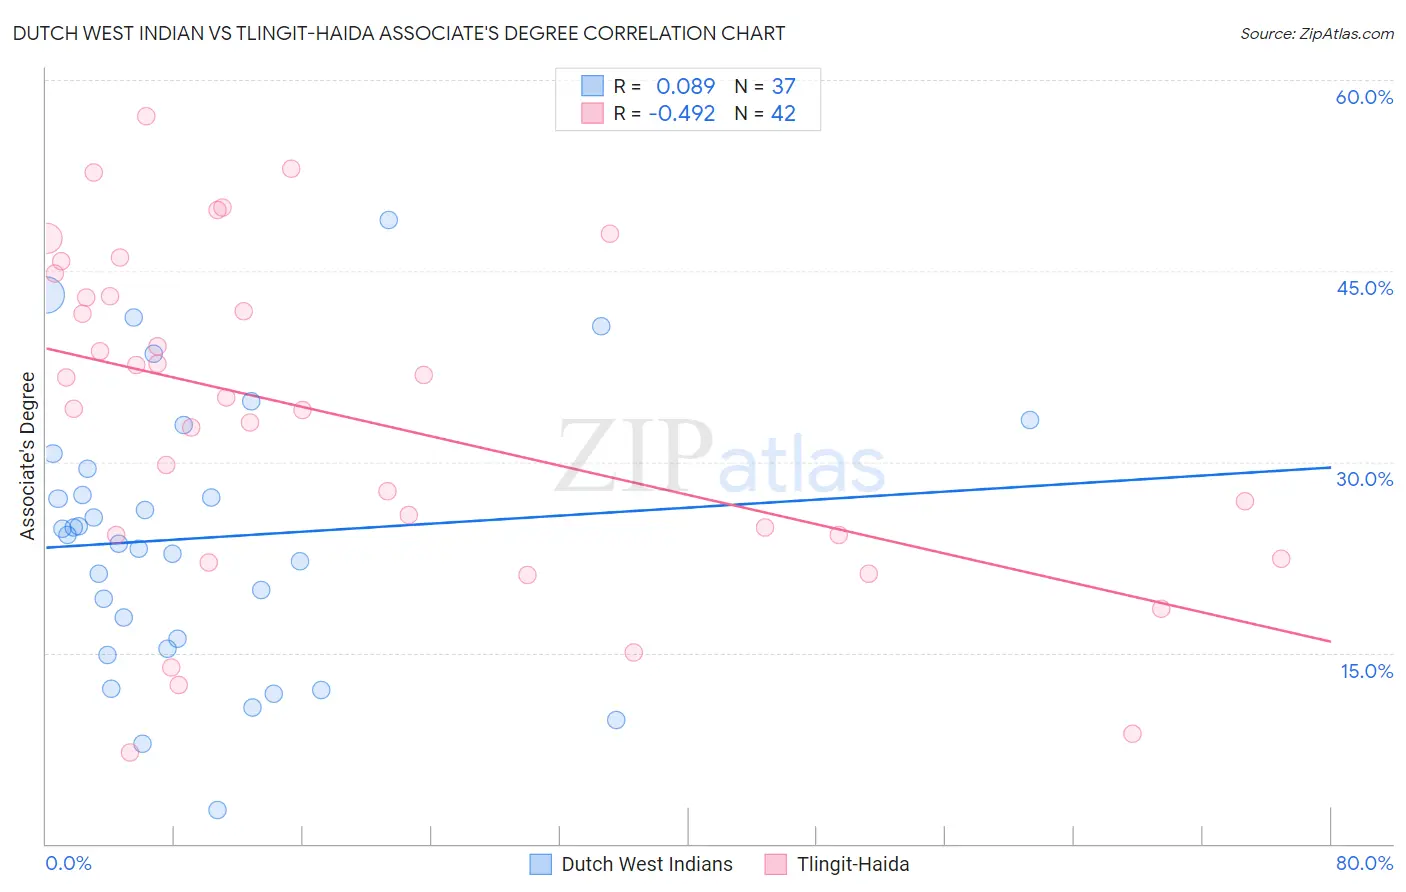
Dutch West Indian vs Tlingit-Haida Associate's Degree Correlation Chart
The statistical analysis conducted on geographies consisting of 85,775,630 people shows a slight positive correlation between the proportion of Dutch West Indians and percentage of population with at least associate's degree education in the United States with a correlation coefficient (R) of 0.089 and weighted average of 36.5%. Similarly, the statistical analysis conducted on geographies consisting of 60,872,339 people shows a moderate negative correlation between the proportion of Tlingit-Haida and percentage of population with at least associate's degree education in the United States with a correlation coefficient (R) of -0.492 and weighted average of 43.0%, a difference of 17.9%.
Associate's Degree Correlation Summary
| Measurement | Dutch West Indian | Tlingit-Haida |
| Minimum | 2.6% | 7.1% |
| Maximum | 49.0% | 57.1% |
| Range | 46.3% | 50.0% |
| Mean | 24.0% | 33.5% |
| Median | 24.3% | 34.6% |
| Interquartile 25% (IQ1) | 15.7% | 24.2% |
| Interquartile 75% (IQ3) | 30.1% | 43.0% |
| Interquartile Range (IQR) | 14.3% | 18.8% |
| Standard Deviation (Sample) | 10.6% | 12.9% |
| Standard Deviation (Population) | 10.4% | 12.7% |
Similar Demographics by Associate's Degree
Demographics Similar to Dutch West Indians by Associate's Degree
In terms of associate's degree, the demographic groups most similar to Dutch West Indians are Alaskan Athabascan (36.5%, a difference of 0.010%), Kiowa (36.5%, a difference of 0.020%), Paiute (36.4%, a difference of 0.30%), Menominee (36.7%, a difference of 0.58%), and Apache (36.2%, a difference of 0.61%).
| Demographics | Rating | Rank | Associate's Degree |
| Cajuns | 0.0 /100 | #320 | Tragic 37.4% |
| Immigrants | Yemen | 0.0 /100 | #321 | Tragic 37.3% |
| Pennsylvania Germans | 0.0 /100 | #322 | Tragic 37.2% |
| Immigrants | Cabo Verde | 0.0 /100 | #323 | Tragic 36.8% |
| Arapaho | 0.0 /100 | #324 | Tragic 36.7% |
| Menominee | 0.0 /100 | #325 | Tragic 36.7% |
| Kiowa | 0.0 /100 | #326 | Tragic 36.5% |
| Dutch West Indians | 0.0 /100 | #327 | Tragic 36.5% |
| Alaskan Athabascans | 0.0 /100 | #328 | Tragic 36.5% |
| Paiute | 0.0 /100 | #329 | Tragic 36.4% |
| Apache | 0.0 /100 | #330 | Tragic 36.2% |
| Immigrants | Azores | 0.0 /100 | #331 | Tragic 35.6% |
| Immigrants | Central America | 0.0 /100 | #332 | Tragic 35.0% |
| Mexicans | 0.0 /100 | #333 | Tragic 35.0% |
| Natives/Alaskans | 0.0 /100 | #334 | Tragic 34.9% |
Demographics Similar to Tlingit-Haida by Associate's Degree
In terms of associate's degree, the demographic groups most similar to Tlingit-Haida are Tongan (43.0%, a difference of 0.090%), Ecuadorian (43.0%, a difference of 0.090%), Immigrants from St. Vincent and the Grenadines (42.9%, a difference of 0.18%), Nonimmigrants (42.9%, a difference of 0.20%), and Native Hawaiian (43.1%, a difference of 0.25%).
| Demographics | Rating | Rank | Associate's Degree |
| Trinidadians and Tobagonians | 4.0 /100 | #227 | Tragic 43.6% |
| Hmong | 3.2 /100 | #228 | Tragic 43.4% |
| Immigrants | Trinidad and Tobago | 3.0 /100 | #229 | Tragic 43.3% |
| Immigrants | Barbados | 2.9 /100 | #230 | Tragic 43.3% |
| Liberians | 2.9 /100 | #231 | Tragic 43.3% |
| Native Hawaiians | 2.3 /100 | #232 | Tragic 43.1% |
| Tongans | 2.2 /100 | #233 | Tragic 43.0% |
| Tlingit-Haida | 2.1 /100 | #234 | Tragic 43.0% |
| Ecuadorians | 2.0 /100 | #235 | Tragic 43.0% |
| Immigrants | St. Vincent and the Grenadines | 1.9 /100 | #236 | Tragic 42.9% |
| Immigrants | Nonimmigrants | 1.9 /100 | #237 | Tragic 42.9% |
| Iroquois | 1.7 /100 | #238 | Tragic 42.8% |
| Immigrants | Grenada | 1.3 /100 | #239 | Tragic 42.6% |
| Cree | 1.2 /100 | #240 | Tragic 42.5% |
| British West Indians | 1.0 /100 | #241 | Tragic 42.4% |