Central American vs Tlingit-Haida Associate's Degree
COMPARE
Central American
Tlingit-Haida
Associate's Degree
Associate's Degree Comparison
Central Americans
Tlingit-Haida
39.4%
ASSOCIATE'S DEGREE
0.0/ 100
METRIC RATING
289th/ 347
METRIC RANK
43.0%
ASSOCIATE'S DEGREE
2.1/ 100
METRIC RATING
234th/ 347
METRIC RANK
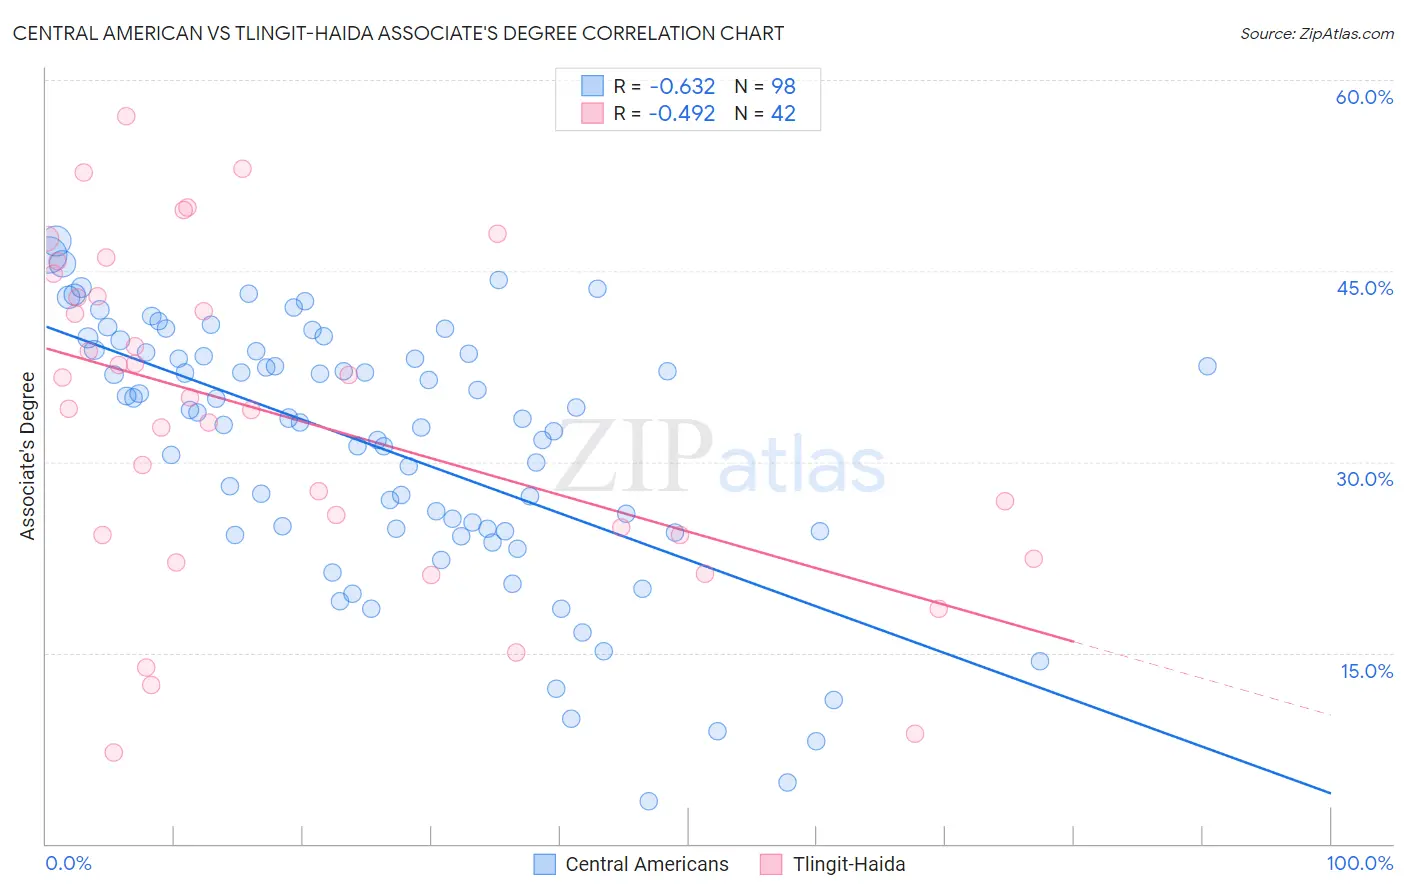
Central American vs Tlingit-Haida Associate's Degree Correlation Chart
The statistical analysis conducted on geographies consisting of 504,559,402 people shows a significant negative correlation between the proportion of Central Americans and percentage of population with at least associate's degree education in the United States with a correlation coefficient (R) of -0.632 and weighted average of 39.4%. Similarly, the statistical analysis conducted on geographies consisting of 60,872,339 people shows a moderate negative correlation between the proportion of Tlingit-Haida and percentage of population with at least associate's degree education in the United States with a correlation coefficient (R) of -0.492 and weighted average of 43.0%, a difference of 9.0%.
Associate's Degree Correlation Summary
| Measurement | Central American | Tlingit-Haida |
| Minimum | 3.3% | 7.1% |
| Maximum | 47.4% | 57.1% |
| Range | 44.0% | 50.0% |
| Mean | 31.1% | 33.5% |
| Median | 33.4% | 34.6% |
| Interquartile 25% (IQ1) | 24.6% | 24.2% |
| Interquartile 75% (IQ3) | 38.6% | 43.0% |
| Interquartile Range (IQR) | 14.0% | 18.8% |
| Standard Deviation (Sample) | 10.1% | 12.9% |
| Standard Deviation (Population) | 10.0% | 12.7% |
Similar Demographics by Associate's Degree
Demographics Similar to Central Americans by Associate's Degree
In terms of associate's degree, the demographic groups most similar to Central Americans are Immigrants from Cuba (39.5%, a difference of 0.26%), Immigrants from Haiti (39.3%, a difference of 0.44%), Dominican (39.3%, a difference of 0.46%), Aleut (39.6%, a difference of 0.50%), and Black/African American (39.1%, a difference of 0.75%).
| Demographics | Rating | Rank | Associate's Degree |
| Bangladeshis | 0.1 /100 | #282 | Tragic 40.0% |
| Haitians | 0.1 /100 | #283 | Tragic 40.0% |
| Comanche | 0.1 /100 | #284 | Tragic 39.9% |
| Immigrants | Belize | 0.1 /100 | #285 | Tragic 39.9% |
| Immigrants | Caribbean | 0.0 /100 | #286 | Tragic 39.7% |
| Aleuts | 0.0 /100 | #287 | Tragic 39.6% |
| Immigrants | Cuba | 0.0 /100 | #288 | Tragic 39.5% |
| Central Americans | 0.0 /100 | #289 | Tragic 39.4% |
| Immigrants | Haiti | 0.0 /100 | #290 | Tragic 39.3% |
| Dominicans | 0.0 /100 | #291 | Tragic 39.3% |
| Blacks/African Americans | 0.0 /100 | #292 | Tragic 39.1% |
| Nepalese | 0.0 /100 | #293 | Tragic 39.0% |
| Salvadorans | 0.0 /100 | #294 | Tragic 39.0% |
| Hondurans | 0.0 /100 | #295 | Tragic 38.9% |
| Cherokee | 0.0 /100 | #296 | Tragic 38.9% |
Demographics Similar to Tlingit-Haida by Associate's Degree
In terms of associate's degree, the demographic groups most similar to Tlingit-Haida are Tongan (43.0%, a difference of 0.090%), Ecuadorian (43.0%, a difference of 0.090%), Immigrants from St. Vincent and the Grenadines (42.9%, a difference of 0.18%), Nonimmigrants (42.9%, a difference of 0.20%), and Native Hawaiian (43.1%, a difference of 0.25%).
| Demographics | Rating | Rank | Associate's Degree |
| Trinidadians and Tobagonians | 4.0 /100 | #227 | Tragic 43.6% |
| Hmong | 3.2 /100 | #228 | Tragic 43.4% |
| Immigrants | Trinidad and Tobago | 3.0 /100 | #229 | Tragic 43.3% |
| Immigrants | Barbados | 2.9 /100 | #230 | Tragic 43.3% |
| Liberians | 2.9 /100 | #231 | Tragic 43.3% |
| Native Hawaiians | 2.3 /100 | #232 | Tragic 43.1% |
| Tongans | 2.2 /100 | #233 | Tragic 43.0% |
| Tlingit-Haida | 2.1 /100 | #234 | Tragic 43.0% |
| Ecuadorians | 2.0 /100 | #235 | Tragic 43.0% |
| Immigrants | St. Vincent and the Grenadines | 1.9 /100 | #236 | Tragic 42.9% |
| Immigrants | Nonimmigrants | 1.9 /100 | #237 | Tragic 42.9% |
| Iroquois | 1.7 /100 | #238 | Tragic 42.8% |
| Immigrants | Grenada | 1.3 /100 | #239 | Tragic 42.6% |
| Cree | 1.2 /100 | #240 | Tragic 42.5% |
| British West Indians | 1.0 /100 | #241 | Tragic 42.4% |