Nicaraguan vs Swedish 11th Grade
COMPARE
Nicaraguan
Swedish
11th Grade
11th Grade Comparison
Nicaraguans
Swedes
88.9%
11TH GRADE
0.0/ 100
METRIC RATING
318th/ 347
METRIC RANK
94.9%
11TH GRADE
100.0/ 100
METRIC RATING
2nd/ 347
METRIC RANK
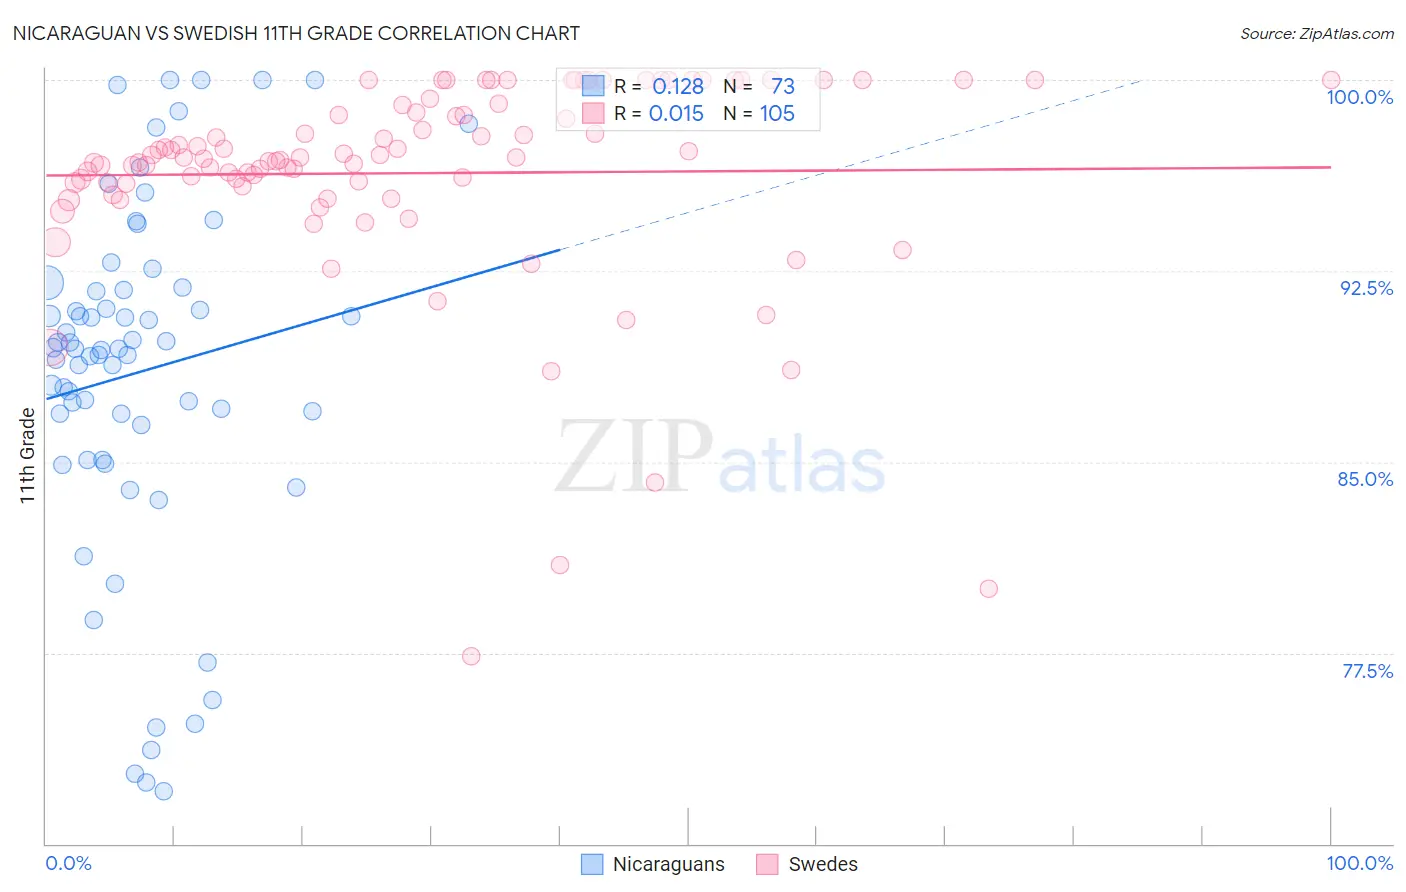
Nicaraguan vs Swedish 11th Grade Correlation Chart
The statistical analysis conducted on geographies consisting of 285,711,651 people shows a poor positive correlation between the proportion of Nicaraguans and percentage of population with at least 11th grade education in the United States with a correlation coefficient (R) of 0.128 and weighted average of 88.9%. Similarly, the statistical analysis conducted on geographies consisting of 539,231,897 people shows no correlation between the proportion of Swedes and percentage of population with at least 11th grade education in the United States with a correlation coefficient (R) of 0.015 and weighted average of 94.9%, a difference of 6.8%.
11th Grade Correlation Summary
| Measurement | Nicaraguan | Swedish |
| Minimum | 72.0% | 77.4% |
| Maximum | 100.0% | 100.0% |
| Range | 28.0% | 22.6% |
| Mean | 88.5% | 96.3% |
| Median | 89.5% | 96.9% |
| Interquartile 25% (IQ1) | 85.8% | 95.9% |
| Interquartile 75% (IQ3) | 91.8% | 99.0% |
| Interquartile Range (IQR) | 6.0% | 3.1% |
| Standard Deviation (Sample) | 6.9% | 4.1% |
| Standard Deviation (Population) | 6.8% | 4.1% |
Similar Demographics by 11th Grade
Demographics Similar to Nicaraguans by 11th Grade
In terms of 11th grade, the demographic groups most similar to Nicaraguans are Lumbee (88.9%, a difference of 0.060%), Immigrants from Cuba (88.9%, a difference of 0.070%), Belizean (88.8%, a difference of 0.090%), Immigrants from Armenia (88.8%, a difference of 0.11%), and Immigrants from Belize (88.7%, a difference of 0.20%).
| Demographics | Rating | Rank | 11th Grade |
| Vietnamese | 0.0 /100 | #311 | Tragic 89.4% |
| Immigrants | Portugal | 0.0 /100 | #312 | Tragic 89.3% |
| Immigrants | Caribbean | 0.0 /100 | #313 | Tragic 89.1% |
| Cape Verdeans | 0.0 /100 | #314 | Tragic 89.1% |
| Immigrants | Ecuador | 0.0 /100 | #315 | Tragic 89.1% |
| Immigrants | Cuba | 0.0 /100 | #316 | Tragic 88.9% |
| Lumbee | 0.0 /100 | #317 | Tragic 88.9% |
| Nicaraguans | 0.0 /100 | #318 | Tragic 88.9% |
| Belizeans | 0.0 /100 | #319 | Tragic 88.8% |
| Immigrants | Armenia | 0.0 /100 | #320 | Tragic 88.8% |
| Immigrants | Belize | 0.0 /100 | #321 | Tragic 88.7% |
| Puerto Ricans | 0.0 /100 | #322 | Tragic 88.4% |
| Pima | 0.0 /100 | #323 | Tragic 88.3% |
| Central American Indians | 0.0 /100 | #324 | Tragic 88.2% |
| Immigrants | Nicaragua | 0.0 /100 | #325 | Tragic 88.1% |
Demographics Similar to Swedes by 11th Grade
In terms of 11th grade, the demographic groups most similar to Swedes are Slovene (94.9%, a difference of 0.010%), Slovak (94.9%, a difference of 0.040%), Carpatho Rusyn (94.8%, a difference of 0.10%), Lithuanian (94.8%, a difference of 0.14%), and Polish (94.8%, a difference of 0.20%).
| Demographics | Rating | Rank | 11th Grade |
| Norwegians | 100.0 /100 | #1 | Exceptional 95.2% |
| Swedes | 100.0 /100 | #2 | Exceptional 94.9% |
| Slovenes | 100.0 /100 | #3 | Exceptional 94.9% |
| Slovaks | 100.0 /100 | #4 | Exceptional 94.9% |
| Carpatho Rusyns | 100.0 /100 | #5 | Exceptional 94.8% |
| Lithuanians | 100.0 /100 | #6 | Exceptional 94.8% |
| Poles | 100.0 /100 | #7 | Exceptional 94.8% |
| Croatians | 100.0 /100 | #8 | Exceptional 94.7% |
| Danes | 100.0 /100 | #9 | Exceptional 94.7% |
| Finns | 100.0 /100 | #10 | Exceptional 94.7% |
| Germans | 100.0 /100 | #11 | Exceptional 94.7% |
| Latvians | 100.0 /100 | #12 | Exceptional 94.7% |
| Chinese | 100.0 /100 | #13 | Exceptional 94.6% |
| Eastern Europeans | 100.0 /100 | #14 | Exceptional 94.6% |
| Bulgarians | 100.0 /100 | #15 | Exceptional 94.5% |