Nicaraguan vs French 7th Grade
COMPARE
Nicaraguan
French
7th Grade
7th Grade Comparison
Nicaraguans
French
93.5%
7TH GRADE
0.0/ 100
METRIC RATING
322nd/ 347
METRIC RANK
97.4%
7TH GRADE
100.0/ 100
METRIC RATING
25th/ 347
METRIC RANK
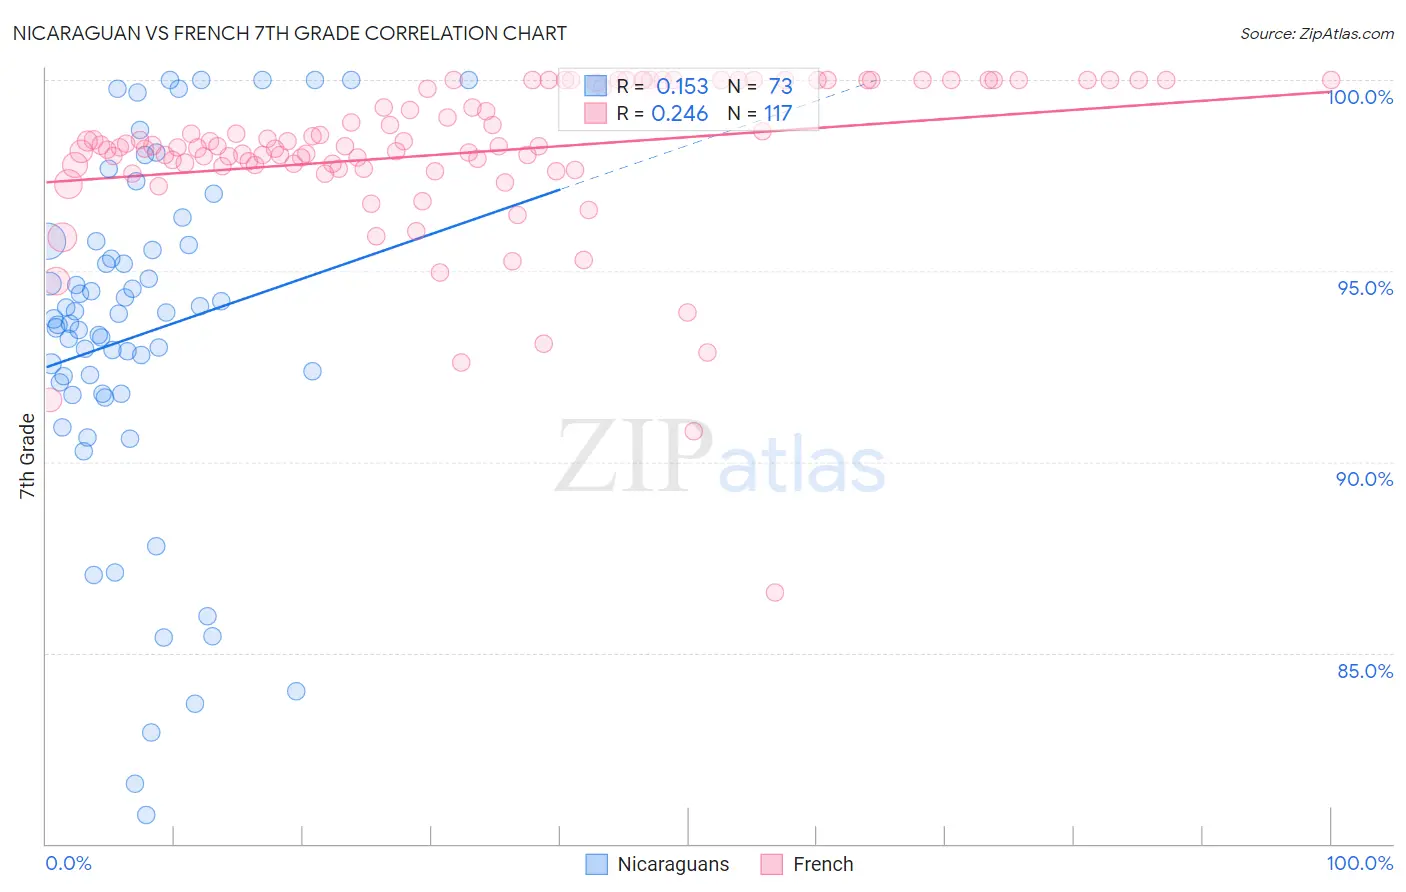
Nicaraguan vs French 7th Grade Correlation Chart
The statistical analysis conducted on geographies consisting of 285,711,651 people shows a poor positive correlation between the proportion of Nicaraguans and percentage of population with at least 7th grade education in the United States with a correlation coefficient (R) of 0.153 and weighted average of 93.5%. Similarly, the statistical analysis conducted on geographies consisting of 572,427,255 people shows a weak positive correlation between the proportion of French and percentage of population with at least 7th grade education in the United States with a correlation coefficient (R) of 0.246 and weighted average of 97.4%, a difference of 4.2%.
7th Grade Correlation Summary
| Measurement | Nicaraguan | French |
| Minimum | 80.8% | 86.6% |
| Maximum | 100.0% | 100.0% |
| Range | 19.2% | 13.4% |
| Mean | 93.3% | 98.1% |
| Median | 93.7% | 98.3% |
| Interquartile 25% (IQ1) | 91.8% | 97.8% |
| Interquartile 75% (IQ3) | 95.7% | 100.0% |
| Interquartile Range (IQR) | 3.9% | 2.2% |
| Standard Deviation (Sample) | 4.5% | 2.1% |
| Standard Deviation (Population) | 4.5% | 2.1% |
Similar Demographics by 7th Grade
Demographics Similar to Nicaraguans by 7th Grade
In terms of 7th grade, the demographic groups most similar to Nicaraguans are Belizean (93.5%, a difference of 0.040%), Immigrants from Fiji (93.5%, a difference of 0.080%), Immigrants from Belize (93.4%, a difference of 0.11%), Dominican (93.3%, a difference of 0.13%), and Central American Indian (93.3%, a difference of 0.20%).
| Demographics | Rating | Rank | 7th Grade |
| Vietnamese | 0.0 /100 | #315 | Tragic 93.9% |
| Immigrants | Vietnam | 0.0 /100 | #316 | Tragic 93.9% |
| Immigrants | Cuba | 0.0 /100 | #317 | Tragic 93.8% |
| Immigrants | Ecuador | 0.0 /100 | #318 | Tragic 93.7% |
| Immigrants | Cambodia | 0.0 /100 | #319 | Tragic 93.7% |
| Immigrants | Fiji | 0.0 /100 | #320 | Tragic 93.5% |
| Belizeans | 0.0 /100 | #321 | Tragic 93.5% |
| Nicaraguans | 0.0 /100 | #322 | Tragic 93.5% |
| Immigrants | Belize | 0.0 /100 | #323 | Tragic 93.4% |
| Dominicans | 0.0 /100 | #324 | Tragic 93.3% |
| Central American Indians | 0.0 /100 | #325 | Tragic 93.3% |
| Nepalese | 0.0 /100 | #326 | Tragic 93.2% |
| Immigrants | Cabo Verde | 0.0 /100 | #327 | Tragic 93.1% |
| Immigrants | Nicaragua | 0.0 /100 | #328 | Tragic 93.0% |
| Immigrants | Azores | 0.0 /100 | #329 | Tragic 93.0% |
Demographics Similar to French by 7th Grade
In terms of 7th grade, the demographic groups most similar to French are Welsh (97.4%, a difference of 0.0%), Scotch-Irish (97.4%, a difference of 0.010%), Danish (97.4%, a difference of 0.010%), Croatian (97.4%, a difference of 0.020%), and French Canadian (97.4%, a difference of 0.030%).
| Demographics | Rating | Rank | 7th Grade |
| Tlingit-Haida | 100.0 /100 | #18 | Exceptional 97.5% |
| Lithuanians | 100.0 /100 | #19 | Exceptional 97.5% |
| Yup'ik | 100.0 /100 | #20 | Exceptional 97.4% |
| Inupiat | 100.0 /100 | #21 | Exceptional 97.4% |
| French Canadians | 100.0 /100 | #22 | Exceptional 97.4% |
| Croatians | 100.0 /100 | #23 | Exceptional 97.4% |
| Welsh | 100.0 /100 | #24 | Exceptional 97.4% |
| French | 100.0 /100 | #25 | Exceptional 97.4% |
| Scotch-Irish | 100.0 /100 | #26 | Exceptional 97.4% |
| Danes | 100.0 /100 | #27 | Exceptional 97.4% |
| Sioux | 100.0 /100 | #28 | Exceptional 97.4% |
| Scandinavians | 100.0 /100 | #29 | Exceptional 97.4% |
| Czechs | 100.0 /100 | #30 | Exceptional 97.4% |
| Europeans | 100.0 /100 | #31 | Exceptional 97.3% |
| Italians | 100.0 /100 | #32 | Exceptional 97.3% |