Nicaraguan vs Immigrants from Somalia 10th Grade
COMPARE
Nicaraguan
Immigrants from Somalia
10th Grade
10th Grade Comparison
Nicaraguans
Immigrants from Somalia
90.2%
10TH GRADE
0.0/ 100
METRIC RATING
319th/ 347
METRIC RANK
93.0%
10TH GRADE
2.7/ 100
METRIC RATING
241st/ 347
METRIC RANK
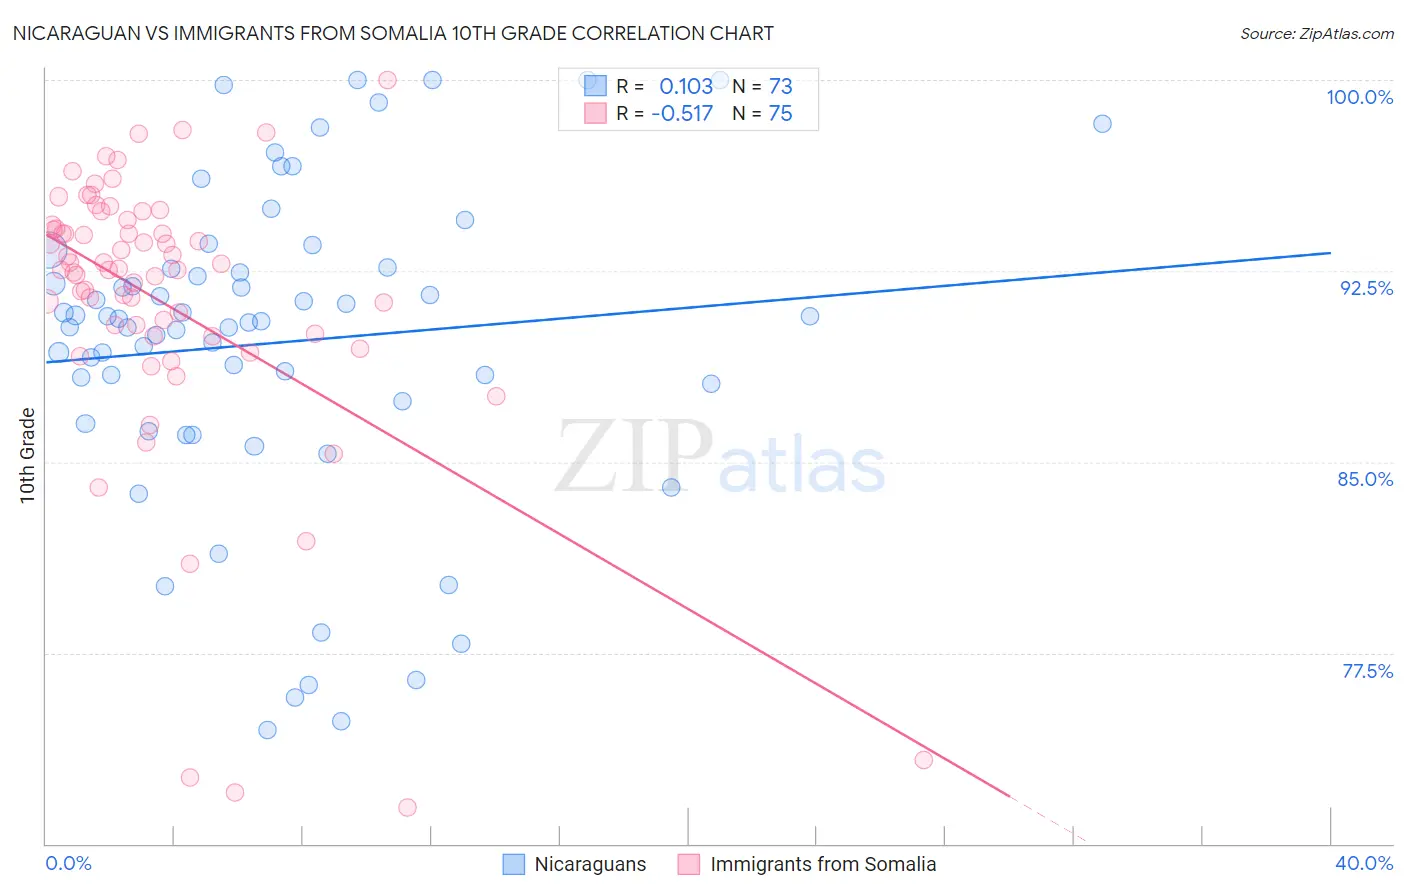
Nicaraguan vs Immigrants from Somalia 10th Grade Correlation Chart
The statistical analysis conducted on geographies consisting of 285,711,651 people shows a poor positive correlation between the proportion of Nicaraguans and percentage of population with at least 10th grade education in the United States with a correlation coefficient (R) of 0.103 and weighted average of 90.2%. Similarly, the statistical analysis conducted on geographies consisting of 92,101,093 people shows a substantial negative correlation between the proportion of Immigrants from Somalia and percentage of population with at least 10th grade education in the United States with a correlation coefficient (R) of -0.517 and weighted average of 93.0%, a difference of 3.1%.
10th Grade Correlation Summary
| Measurement | Nicaraguan | Immigrants from Somalia |
| Minimum | 74.5% | 71.4% |
| Maximum | 100.0% | 100.0% |
| Range | 25.5% | 28.6% |
| Mean | 89.7% | 91.2% |
| Median | 90.5% | 92.6% |
| Interquartile 25% (IQ1) | 86.9% | 89.9% |
| Interquartile 75% (IQ3) | 92.6% | 94.3% |
| Interquartile Range (IQR) | 5.7% | 4.3% |
| Standard Deviation (Sample) | 6.3% | 5.7% |
| Standard Deviation (Population) | 6.2% | 5.7% |
Similar Demographics by 10th Grade
Demographics Similar to Nicaraguans by 10th Grade
In terms of 10th grade, the demographic groups most similar to Nicaraguans are Houma (90.2%, a difference of 0.010%), Belizean (90.2%, a difference of 0.010%), Tohono O'odham (90.1%, a difference of 0.020%), Immigrants from Cuba (90.2%, a difference of 0.080%), and Immigrants from Belize (90.1%, a difference of 0.11%).
| Demographics | Rating | Rank | 10th Grade |
| Immigrants | Portugal | 0.0 /100 | #312 | Tragic 90.8% |
| Cape Verdeans | 0.0 /100 | #313 | Tragic 90.8% |
| Nepalese | 0.0 /100 | #314 | Tragic 90.7% |
| Immigrants | Caribbean | 0.0 /100 | #315 | Tragic 90.6% |
| Ecuadorians | 0.0 /100 | #316 | Tragic 90.6% |
| Immigrants | Ecuador | 0.0 /100 | #317 | Tragic 90.4% |
| Immigrants | Cuba | 0.0 /100 | #318 | Tragic 90.2% |
| Nicaraguans | 0.0 /100 | #319 | Tragic 90.2% |
| Houma | 0.0 /100 | #320 | Tragic 90.2% |
| Belizeans | 0.0 /100 | #321 | Tragic 90.2% |
| Tohono O'odham | 0.0 /100 | #322 | Tragic 90.1% |
| Immigrants | Belize | 0.0 /100 | #323 | Tragic 90.1% |
| Immigrants | Armenia | 0.0 /100 | #324 | Tragic 89.9% |
| Puerto Ricans | 0.0 /100 | #325 | Tragic 89.8% |
| Central American Indians | 0.0 /100 | #326 | Tragic 89.7% |
Demographics Similar to Immigrants from Somalia by 10th Grade
In terms of 10th grade, the demographic groups most similar to Immigrants from Somalia are Immigrants from Cameroon (93.0%, a difference of 0.0%), Senegalese (93.0%, a difference of 0.030%), Spanish American (92.9%, a difference of 0.060%), Uruguayan (92.9%, a difference of 0.080%), and Immigrants from Hong Kong (93.1%, a difference of 0.10%).
| Demographics | Rating | Rank | 10th Grade |
| Sub-Saharan Africans | 4.7 /100 | #234 | Tragic 93.1% |
| Africans | 4.6 /100 | #235 | Tragic 93.1% |
| Afghans | 4.5 /100 | #236 | Tragic 93.1% |
| Immigrants | Panama | 4.3 /100 | #237 | Tragic 93.1% |
| Nigerians | 4.2 /100 | #238 | Tragic 93.1% |
| Costa Ricans | 4.2 /100 | #239 | Tragic 93.1% |
| Immigrants | Hong Kong | 4.2 /100 | #240 | Tragic 93.1% |
| Immigrants | Somalia | 2.7 /100 | #241 | Tragic 93.0% |
| Immigrants | Cameroon | 2.6 /100 | #242 | Tragic 93.0% |
| Senegalese | 2.4 /100 | #243 | Tragic 93.0% |
| Spanish Americans | 2.1 /100 | #244 | Tragic 92.9% |
| Uruguayans | 1.8 /100 | #245 | Tragic 92.9% |
| Immigrants | Middle Africa | 1.7 /100 | #246 | Tragic 92.9% |
| Immigrants | Afghanistan | 1.4 /100 | #247 | Tragic 92.8% |
| Colombians | 1.4 /100 | #248 | Tragic 92.8% |