Immigrants from Northern Africa vs Alaska Native 8th Grade
COMPARE
Immigrants from Northern Africa
Alaska Native
8th Grade
8th Grade Comparison
Immigrants from Northern Africa
Alaska Natives
95.5%
8TH GRADE
22.5/ 100
METRIC RATING
199th/ 347
METRIC RANK
97.0%
8TH GRADE
100.0/ 100
METRIC RATING
35th/ 347
METRIC RANK
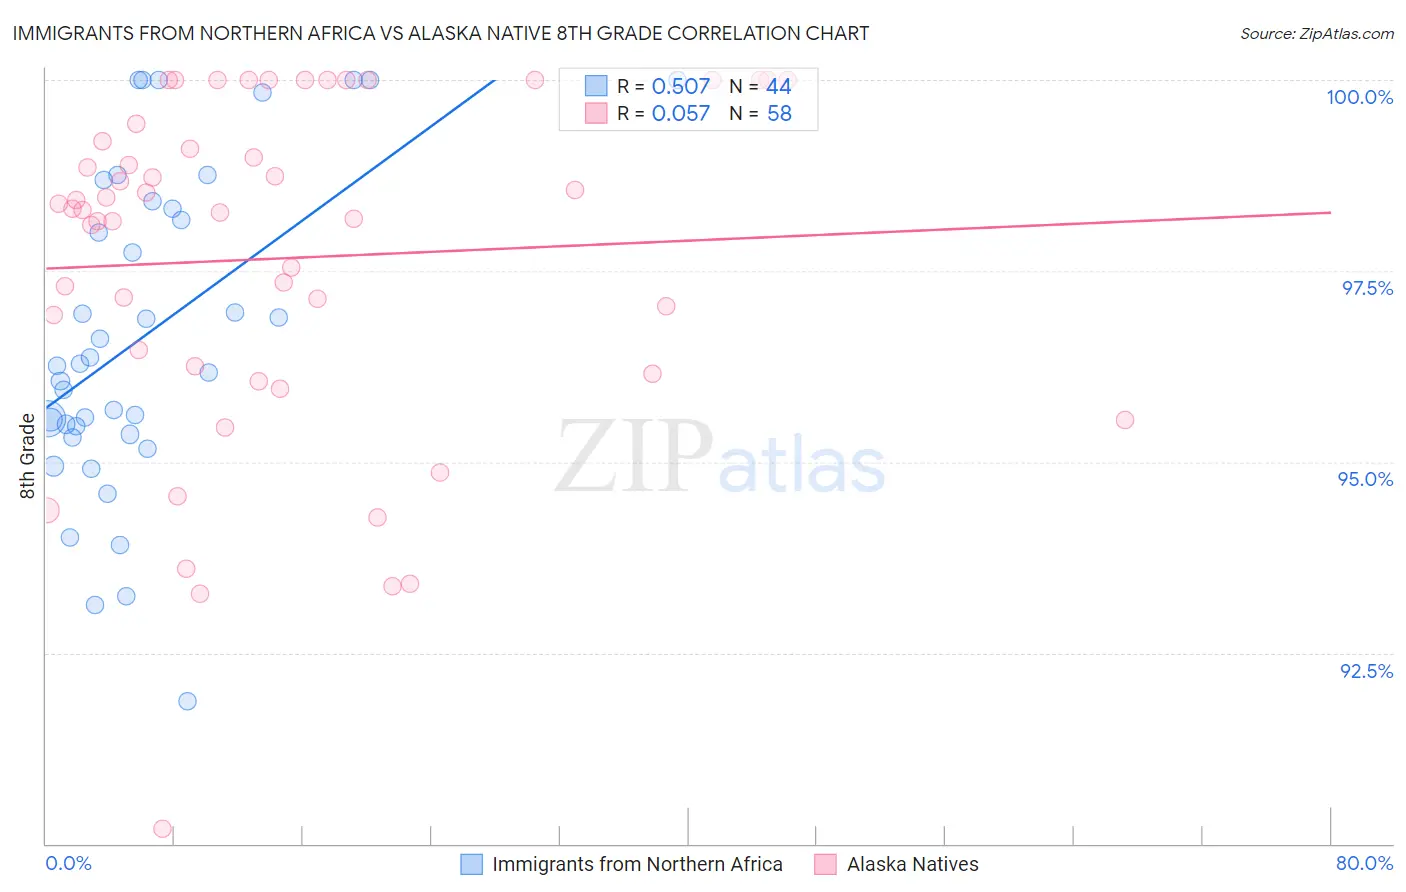
Immigrants from Northern Africa vs Alaska Native 8th Grade Correlation Chart
The statistical analysis conducted on geographies consisting of 321,196,768 people shows a substantial positive correlation between the proportion of Immigrants from Northern Africa and percentage of population with at least 8th grade education in the United States with a correlation coefficient (R) of 0.507 and weighted average of 95.5%. Similarly, the statistical analysis conducted on geographies consisting of 76,778,057 people shows a slight positive correlation between the proportion of Alaska Natives and percentage of population with at least 8th grade education in the United States with a correlation coefficient (R) of 0.057 and weighted average of 97.0%, a difference of 1.5%.
8th Grade Correlation Summary
| Measurement | Immigrants from Northern Africa | Alaska Native |
| Minimum | 91.9% | 90.2% |
| Maximum | 100.0% | 100.0% |
| Range | 8.1% | 9.8% |
| Mean | 96.7% | 97.7% |
| Median | 96.3% | 98.3% |
| Interquartile 25% (IQ1) | 95.4% | 96.2% |
| Interquartile 75% (IQ3) | 98.4% | 99.4% |
| Interquartile Range (IQR) | 3.0% | 3.2% |
| Standard Deviation (Sample) | 2.1% | 2.2% |
| Standard Deviation (Population) | 2.1% | 2.2% |
Similar Demographics by 8th Grade
Demographics Similar to Immigrants from Northern Africa by 8th Grade
In terms of 8th grade, the demographic groups most similar to Immigrants from Northern Africa are Paraguayan (95.5%, a difference of 0.0%), Argentinean (95.5%, a difference of 0.0%), Immigrants from Zaire (95.6%, a difference of 0.020%), Assyrian/Chaldean/Syriac (95.6%, a difference of 0.020%), and Sierra Leonean (95.6%, a difference of 0.020%).
| Demographics | Rating | Rank | 8th Grade |
| Pima | 28.6 /100 | #192 | Fair 95.6% |
| Panamanians | 28.4 /100 | #193 | Fair 95.6% |
| Guamanians/Chamorros | 26.6 /100 | #194 | Fair 95.6% |
| Immigrants | Zaire | 25.2 /100 | #195 | Fair 95.6% |
| Assyrians/Chaldeans/Syriacs | 24.5 /100 | #196 | Fair 95.6% |
| Sierra Leoneans | 24.3 /100 | #197 | Fair 95.6% |
| Paraguayans | 22.6 /100 | #198 | Fair 95.5% |
| Immigrants | Northern Africa | 22.5 /100 | #199 | Fair 95.5% |
| Argentineans | 22.2 /100 | #200 | Fair 95.5% |
| Immigrants | Argentina | 20.6 /100 | #201 | Fair 95.5% |
| Apache | 19.4 /100 | #202 | Poor 95.5% |
| Moroccans | 17.4 /100 | #203 | Poor 95.5% |
| Hawaiians | 16.7 /100 | #204 | Poor 95.5% |
| Immigrants | Bahamas | 16.7 /100 | #205 | Poor 95.5% |
| Comanche | 16.3 /100 | #206 | Poor 95.5% |
Demographics Similar to Alaska Natives by 8th Grade
In terms of 8th grade, the demographic groups most similar to Alaska Natives are Luxembourger (97.0%, a difference of 0.010%), Belgian (97.0%, a difference of 0.010%), Latvian (97.0%, a difference of 0.010%), British (97.0%, a difference of 0.030%), and Hungarian (97.0%, a difference of 0.030%).
| Demographics | Rating | Rank | 8th Grade |
| Italians | 100.0 /100 | #28 | Exceptional 97.1% |
| Europeans | 100.0 /100 | #29 | Exceptional 97.1% |
| Sioux | 100.0 /100 | #30 | Exceptional 97.1% |
| Chippewa | 100.0 /100 | #31 | Exceptional 97.1% |
| Yup'ik | 100.0 /100 | #32 | Exceptional 97.0% |
| Swiss | 100.0 /100 | #33 | Exceptional 97.0% |
| Luxembourgers | 100.0 /100 | #34 | Exceptional 97.0% |
| Alaska Natives | 100.0 /100 | #35 | Exceptional 97.0% |
| Belgians | 100.0 /100 | #36 | Exceptional 97.0% |
| Latvians | 100.0 /100 | #37 | Exceptional 97.0% |
| British | 100.0 /100 | #38 | Exceptional 97.0% |
| Hungarians | 100.0 /100 | #39 | Exceptional 97.0% |
| Inupiat | 100.0 /100 | #40 | Exceptional 97.0% |
| Eastern Europeans | 100.0 /100 | #41 | Exceptional 97.0% |
| Chinese | 100.0 /100 | #42 | Exceptional 96.9% |