Immigrants from Germany vs Alaska Native 8th Grade
COMPARE
Immigrants from Germany
Alaska Native
8th Grade
8th Grade Comparison
Immigrants from Germany
Alaska Natives
96.4%
8TH GRADE
98.7/ 100
METRIC RATING
98th/ 347
METRIC RANK
97.0%
8TH GRADE
100.0/ 100
METRIC RATING
35th/ 347
METRIC RANK
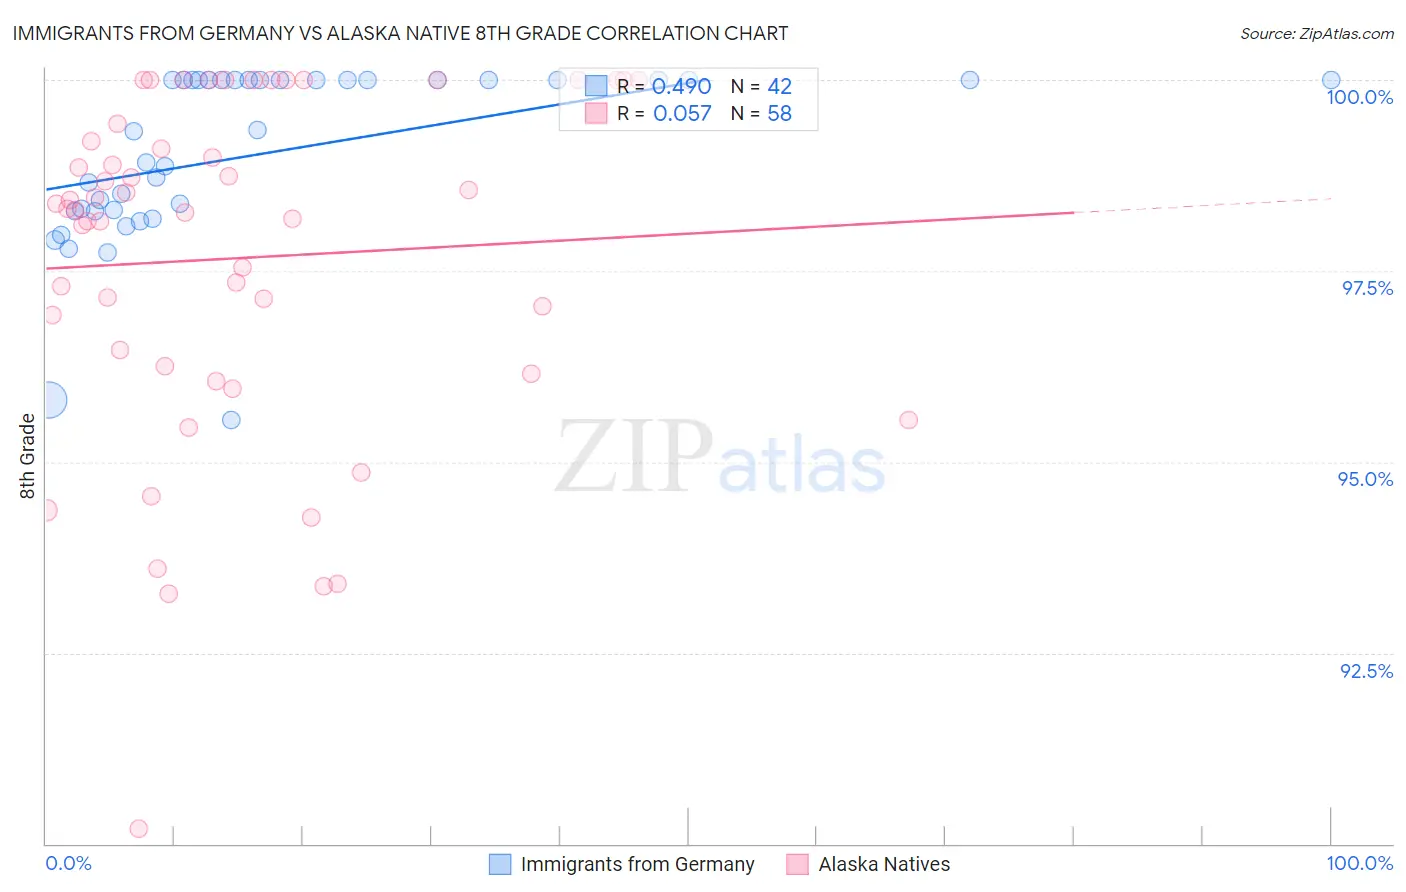
Immigrants from Germany vs Alaska Native 8th Grade Correlation Chart
The statistical analysis conducted on geographies consisting of 463,886,845 people shows a moderate positive correlation between the proportion of Immigrants from Germany and percentage of population with at least 8th grade education in the United States with a correlation coefficient (R) of 0.490 and weighted average of 96.4%. Similarly, the statistical analysis conducted on geographies consisting of 76,778,057 people shows a slight positive correlation between the proportion of Alaska Natives and percentage of population with at least 8th grade education in the United States with a correlation coefficient (R) of 0.057 and weighted average of 97.0%, a difference of 0.62%.
8th Grade Correlation Summary
| Measurement | Immigrants from Germany | Alaska Native |
| Minimum | 95.6% | 90.2% |
| Maximum | 100.0% | 100.0% |
| Range | 4.4% | 9.8% |
| Mean | 99.0% | 97.7% |
| Median | 99.3% | 98.3% |
| Interquartile 25% (IQ1) | 98.3% | 96.2% |
| Interquartile 75% (IQ3) | 100.0% | 99.4% |
| Interquartile Range (IQR) | 1.7% | 3.2% |
| Standard Deviation (Sample) | 1.1% | 2.2% |
| Standard Deviation (Population) | 1.1% | 2.2% |
Similar Demographics by 8th Grade
Demographics Similar to Immigrants from Germany by 8th Grade
In terms of 8th grade, the demographic groups most similar to Immigrants from Germany are Potawatomi (96.4%, a difference of 0.0%), Osage (96.4%, a difference of 0.0%), Cree (96.4%, a difference of 0.0%), Immigrants from Singapore (96.4%, a difference of 0.010%), and German Russian (96.4%, a difference of 0.010%).
| Demographics | Rating | Rank | 8th Grade |
| Thais | 98.9 /100 | #91 | Exceptional 96.4% |
| Menominee | 98.9 /100 | #92 | Exceptional 96.4% |
| Immigrants | Denmark | 98.8 /100 | #93 | Exceptional 96.4% |
| Immigrants | Singapore | 98.8 /100 | #94 | Exceptional 96.4% |
| German Russians | 98.8 /100 | #95 | Exceptional 96.4% |
| Potawatomi | 98.7 /100 | #96 | Exceptional 96.4% |
| Osage | 98.7 /100 | #97 | Exceptional 96.4% |
| Immigrants | Germany | 98.7 /100 | #98 | Exceptional 96.4% |
| Cree | 98.6 /100 | #99 | Exceptional 96.4% |
| Immigrants | Czechoslovakia | 98.6 /100 | #100 | Exceptional 96.4% |
| Bhutanese | 98.2 /100 | #101 | Exceptional 96.4% |
| South Africans | 98.2 /100 | #102 | Exceptional 96.4% |
| Immigrants | Saudi Arabia | 98.0 /100 | #103 | Exceptional 96.3% |
| Kiowa | 98.0 /100 | #104 | Exceptional 96.3% |
| Immigrants | North Macedonia | 98.0 /100 | #105 | Exceptional 96.3% |
Demographics Similar to Alaska Natives by 8th Grade
In terms of 8th grade, the demographic groups most similar to Alaska Natives are Luxembourger (97.0%, a difference of 0.010%), Belgian (97.0%, a difference of 0.010%), Latvian (97.0%, a difference of 0.010%), British (97.0%, a difference of 0.030%), and Hungarian (97.0%, a difference of 0.030%).
| Demographics | Rating | Rank | 8th Grade |
| Italians | 100.0 /100 | #28 | Exceptional 97.1% |
| Europeans | 100.0 /100 | #29 | Exceptional 97.1% |
| Sioux | 100.0 /100 | #30 | Exceptional 97.1% |
| Chippewa | 100.0 /100 | #31 | Exceptional 97.1% |
| Yup'ik | 100.0 /100 | #32 | Exceptional 97.0% |
| Swiss | 100.0 /100 | #33 | Exceptional 97.0% |
| Luxembourgers | 100.0 /100 | #34 | Exceptional 97.0% |
| Alaska Natives | 100.0 /100 | #35 | Exceptional 97.0% |
| Belgians | 100.0 /100 | #36 | Exceptional 97.0% |
| Latvians | 100.0 /100 | #37 | Exceptional 97.0% |
| British | 100.0 /100 | #38 | Exceptional 97.0% |
| Hungarians | 100.0 /100 | #39 | Exceptional 97.0% |
| Inupiat | 100.0 /100 | #40 | Exceptional 97.0% |
| Eastern Europeans | 100.0 /100 | #41 | Exceptional 97.0% |
| Chinese | 100.0 /100 | #42 | Exceptional 96.9% |