New Zealander vs White/Caucasian High School Diploma
COMPARE
New Zealander
White/Caucasian
High School Diploma
High School Diploma Comparison
New Zealanders
Whites/Caucasians
91.1%
HIGH SCHOOL DIPLOMA
99.7/ 100
METRIC RATING
51st/ 347
METRIC RANK
90.1%
HIGH SCHOOL DIPLOMA
94.1/ 100
METRIC RATING
121st/ 347
METRIC RANK
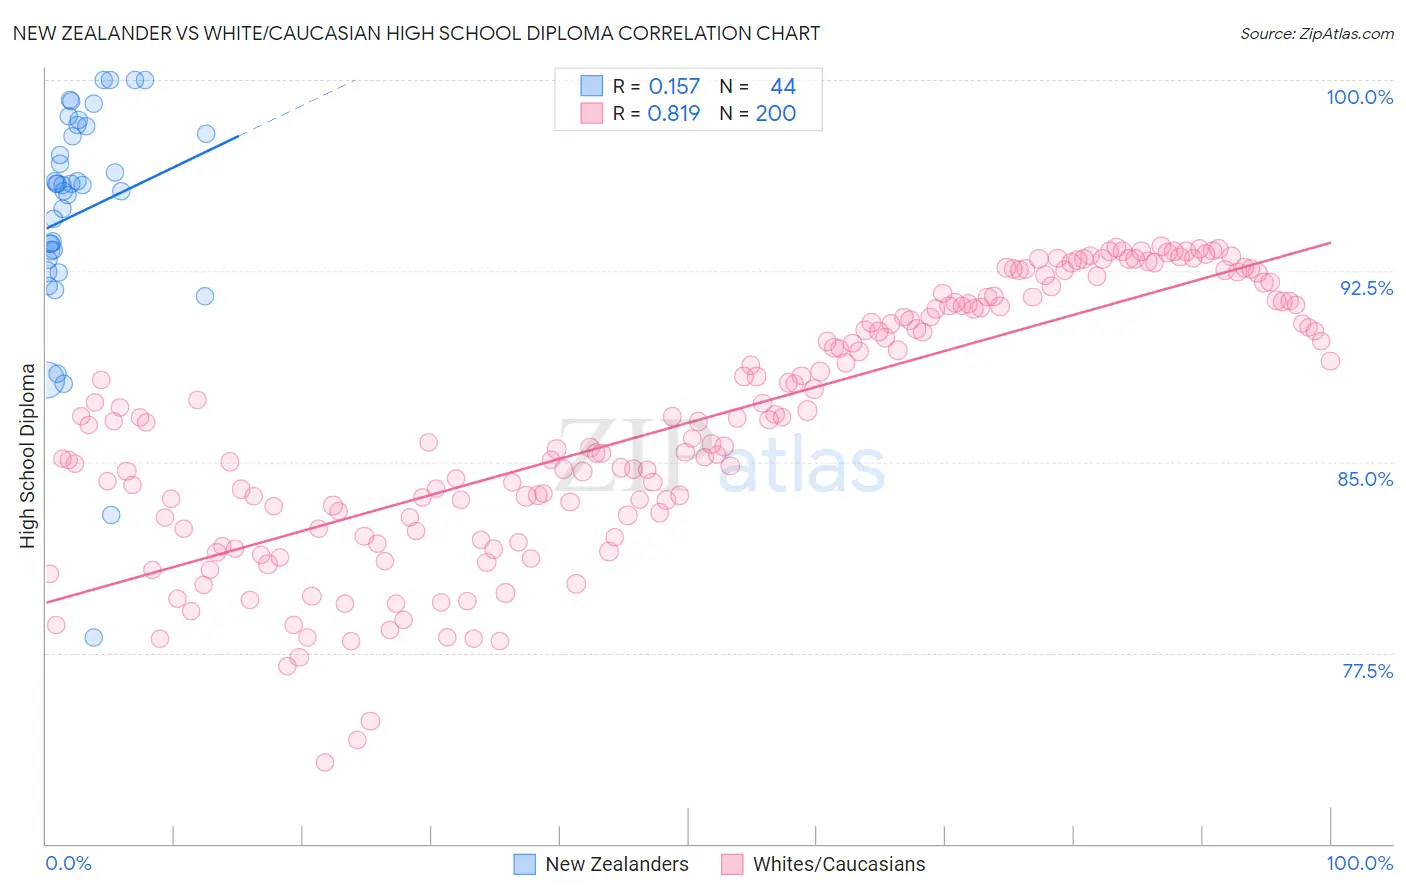
New Zealander vs White/Caucasian High School Diploma Correlation Chart
The statistical analysis conducted on geographies consisting of 106,912,544 people shows a poor positive correlation between the proportion of New Zealanders and percentage of population with at least high school diploma education in the United States with a correlation coefficient (R) of 0.157 and weighted average of 91.1%. Similarly, the statistical analysis conducted on geographies consisting of 585,242,062 people shows a very strong positive correlation between the proportion of Whites/Caucasians and percentage of population with at least high school diploma education in the United States with a correlation coefficient (R) of 0.819 and weighted average of 90.1%, a difference of 1.2%.
High School Diploma Correlation Summary
| Measurement | New Zealander | White/Caucasian |
| Minimum | 78.1% | 73.2% |
| Maximum | 100.0% | 93.5% |
| Range | 21.9% | 20.3% |
| Mean | 94.8% | 86.5% |
| Median | 95.9% | 86.6% |
| Interquartile 25% (IQ1) | 93.1% | 82.9% |
| Interquartile 75% (IQ3) | 98.0% | 91.2% |
| Interquartile Range (IQR) | 4.9% | 8.3% |
| Standard Deviation (Sample) | 4.5% | 5.0% |
| Standard Deviation (Population) | 4.4% | 5.0% |
Similar Demographics by High School Diploma
Demographics Similar to New Zealanders by High School Diploma
In terms of high school diploma, the demographic groups most similar to New Zealanders are Immigrants from Sweden (91.1%, a difference of 0.0%), Immigrants from Belgium (91.1%, a difference of 0.0%), Macedonian (91.1%, a difference of 0.020%), Serbian (91.1%, a difference of 0.040%), and Welsh (91.2%, a difference of 0.050%).
| Demographics | Rating | Rank | High School Diploma |
| Immigrants | Austria | 99.8 /100 | #44 | Exceptional 91.3% |
| Turks | 99.8 /100 | #45 | Exceptional 91.2% |
| Greeks | 99.8 /100 | #46 | Exceptional 91.2% |
| Australians | 99.8 /100 | #47 | Exceptional 91.2% |
| Belgians | 99.8 /100 | #48 | Exceptional 91.2% |
| Bhutanese | 99.8 /100 | #49 | Exceptional 91.2% |
| Welsh | 99.8 /100 | #50 | Exceptional 91.2% |
| New Zealanders | 99.7 /100 | #51 | Exceptional 91.1% |
| Immigrants | Sweden | 99.7 /100 | #52 | Exceptional 91.1% |
| Immigrants | Belgium | 99.7 /100 | #53 | Exceptional 91.1% |
| Macedonians | 99.7 /100 | #54 | Exceptional 91.1% |
| Serbians | 99.7 /100 | #55 | Exceptional 91.1% |
| Immigrants | Canada | 99.7 /100 | #56 | Exceptional 91.1% |
| Zimbabweans | 99.7 /100 | #57 | Exceptional 91.1% |
| Slavs | 99.7 /100 | #58 | Exceptional 91.0% |
Demographics Similar to Whites/Caucasians by High School Diploma
In terms of high school diploma, the demographic groups most similar to Whites/Caucasians are Ottawa (90.1%, a difference of 0.020%), Immigrants from Kazakhstan (90.0%, a difference of 0.050%), Immigrants from Eastern Europe (90.1%, a difference of 0.060%), Israeli (90.1%, a difference of 0.070%), and Jordanian (90.2%, a difference of 0.10%).
| Demographics | Rating | Rank | High School Diploma |
| Yugoslavians | 96.2 /100 | #114 | Exceptional 90.2% |
| Immigrants | Hungary | 95.8 /100 | #115 | Exceptional 90.2% |
| Immigrants | Germany | 95.7 /100 | #116 | Exceptional 90.2% |
| Jordanians | 95.4 /100 | #117 | Exceptional 90.2% |
| Israelis | 95.1 /100 | #118 | Exceptional 90.1% |
| Immigrants | Eastern Europe | 94.9 /100 | #119 | Exceptional 90.1% |
| Ottawa | 94.4 /100 | #120 | Exceptional 90.1% |
| Whites/Caucasians | 94.1 /100 | #121 | Exceptional 90.1% |
| Immigrants | Kazakhstan | 93.4 /100 | #122 | Exceptional 90.0% |
| German Russians | 92.0 /100 | #123 | Exceptional 90.0% |
| Mongolians | 91.6 /100 | #124 | Exceptional 89.9% |
| Egyptians | 91.1 /100 | #125 | Exceptional 89.9% |
| Alaska Natives | 91.0 /100 | #126 | Exceptional 89.9% |
| Immigrants | Eastern Asia | 89.2 /100 | #127 | Excellent 89.9% |
| Puget Sound Salish | 89.1 /100 | #128 | Excellent 89.9% |