New Zealander vs White/Caucasian Master's Degree
COMPARE
New Zealander
White/Caucasian
Master's Degree
Master's Degree Comparison
New Zealanders
Whites/Caucasians
18.3%
MASTER'S DEGREE
99.9/ 100
METRIC RATING
60th/ 347
METRIC RANK
13.8%
MASTER'S DEGREE
9.1/ 100
METRIC RATING
228th/ 347
METRIC RANK
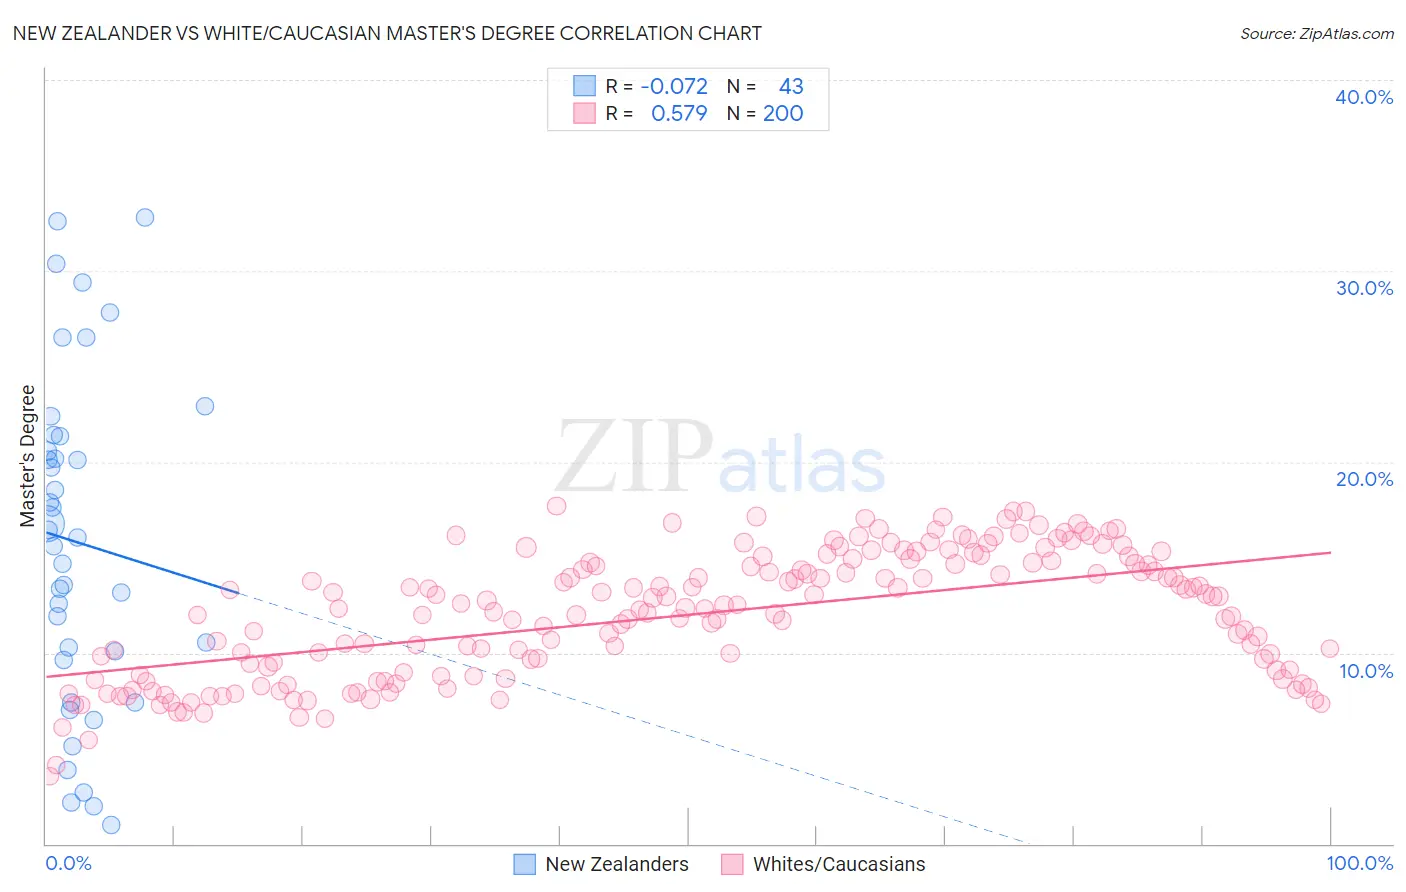
New Zealander vs White/Caucasian Master's Degree Correlation Chart
The statistical analysis conducted on geographies consisting of 106,899,684 people shows a slight negative correlation between the proportion of New Zealanders and percentage of population with at least master's degree education in the United States with a correlation coefficient (R) of -0.072 and weighted average of 18.3%. Similarly, the statistical analysis conducted on geographies consisting of 583,022,214 people shows a substantial positive correlation between the proportion of Whites/Caucasians and percentage of population with at least master's degree education in the United States with a correlation coefficient (R) of 0.579 and weighted average of 13.8%, a difference of 32.2%.
Master's Degree Correlation Summary
| Measurement | New Zealander | White/Caucasian |
| Minimum | 1.0% | 3.5% |
| Maximum | 32.8% | 17.7% |
| Range | 31.8% | 14.2% |
| Mean | 15.8% | 12.0% |
| Median | 16.0% | 12.3% |
| Interquartile 25% (IQ1) | 9.6% | 8.9% |
| Interquartile 75% (IQ3) | 21.3% | 14.7% |
| Interquartile Range (IQR) | 11.7% | 5.8% |
| Standard Deviation (Sample) | 8.6% | 3.2% |
| Standard Deviation (Population) | 8.5% | 3.2% |
Similar Demographics by Master's Degree
Demographics Similar to New Zealanders by Master's Degree
In terms of master's degree, the demographic groups most similar to New Zealanders are Immigrants from Europe (18.2%, a difference of 0.15%), Immigrants from Bulgaria (18.3%, a difference of 0.23%), Argentinean (18.2%, a difference of 0.51%), Australian (18.4%, a difference of 0.66%), and Immigrants from Asia (18.4%, a difference of 0.80%).
| Demographics | Rating | Rank | Master's Degree |
| Immigrants | Czechoslovakia | 99.9 /100 | #53 | Exceptional 18.5% |
| Immigrants | Lithuania | 99.9 /100 | #54 | Exceptional 18.5% |
| Immigrants | Serbia | 99.9 /100 | #55 | Exceptional 18.5% |
| Asians | 99.9 /100 | #56 | Exceptional 18.4% |
| Immigrants | Asia | 99.9 /100 | #57 | Exceptional 18.4% |
| Australians | 99.9 /100 | #58 | Exceptional 18.4% |
| Immigrants | Bulgaria | 99.9 /100 | #59 | Exceptional 18.3% |
| New Zealanders | 99.9 /100 | #60 | Exceptional 18.3% |
| Immigrants | Europe | 99.9 /100 | #61 | Exceptional 18.2% |
| Argentineans | 99.9 /100 | #62 | Exceptional 18.2% |
| Immigrants | Netherlands | 99.9 /100 | #63 | Exceptional 18.1% |
| South Africans | 99.9 /100 | #64 | Exceptional 18.1% |
| Immigrants | Kazakhstan | 99.8 /100 | #65 | Exceptional 18.0% |
| Ethiopians | 99.8 /100 | #66 | Exceptional 18.0% |
| Immigrants | Argentina | 99.8 /100 | #67 | Exceptional 18.0% |
Demographics Similar to Whites/Caucasians by Master's Degree
In terms of master's degree, the demographic groups most similar to Whites/Caucasians are British West Indian (13.8%, a difference of 0.10%), Dutch (13.8%, a difference of 0.14%), Immigrants from West Indies (13.9%, a difference of 0.31%), Guyanese (13.7%, a difference of 0.68%), and Immigrants from St. Vincent and the Grenadines (13.9%, a difference of 0.76%).
| Demographics | Rating | Rank | Master's Degree |
| Koreans | 12.7 /100 | #221 | Poor 14.0% |
| Ecuadorians | 12.6 /100 | #222 | Poor 14.0% |
| Immigrants | South Eastern Asia | 11.9 /100 | #223 | Poor 14.0% |
| Immigrants | Grenada | 11.8 /100 | #224 | Poor 14.0% |
| Portuguese | 11.2 /100 | #225 | Poor 13.9% |
| Immigrants | St. Vincent and the Grenadines | 11.0 /100 | #226 | Poor 13.9% |
| Immigrants | West Indies | 9.8 /100 | #227 | Tragic 13.9% |
| Whites/Caucasians | 9.1 /100 | #228 | Tragic 13.8% |
| British West Indians | 8.8 /100 | #229 | Tragic 13.8% |
| Dutch | 8.7 /100 | #230 | Tragic 13.8% |
| Guyanese | 7.6 /100 | #231 | Tragic 13.7% |
| Immigrants | Philippines | 6.0 /100 | #232 | Tragic 13.6% |
| Immigrants | Ecuador | 5.7 /100 | #233 | Tragic 13.6% |
| Immigrants | Burma/Myanmar | 5.0 /100 | #234 | Tragic 13.5% |
| German Russians | 4.5 /100 | #235 | Tragic 13.5% |