Nepalese vs Cajun 9th Grade
COMPARE
Nepalese
Cajun
9th Grade
9th Grade Comparison
Nepalese
Cajuns
92.0%
9TH GRADE
0.0/ 100
METRIC RATING
318th/ 347
METRIC RANK
95.1%
9TH GRADE
77.3/ 100
METRIC RATING
151st/ 347
METRIC RANK
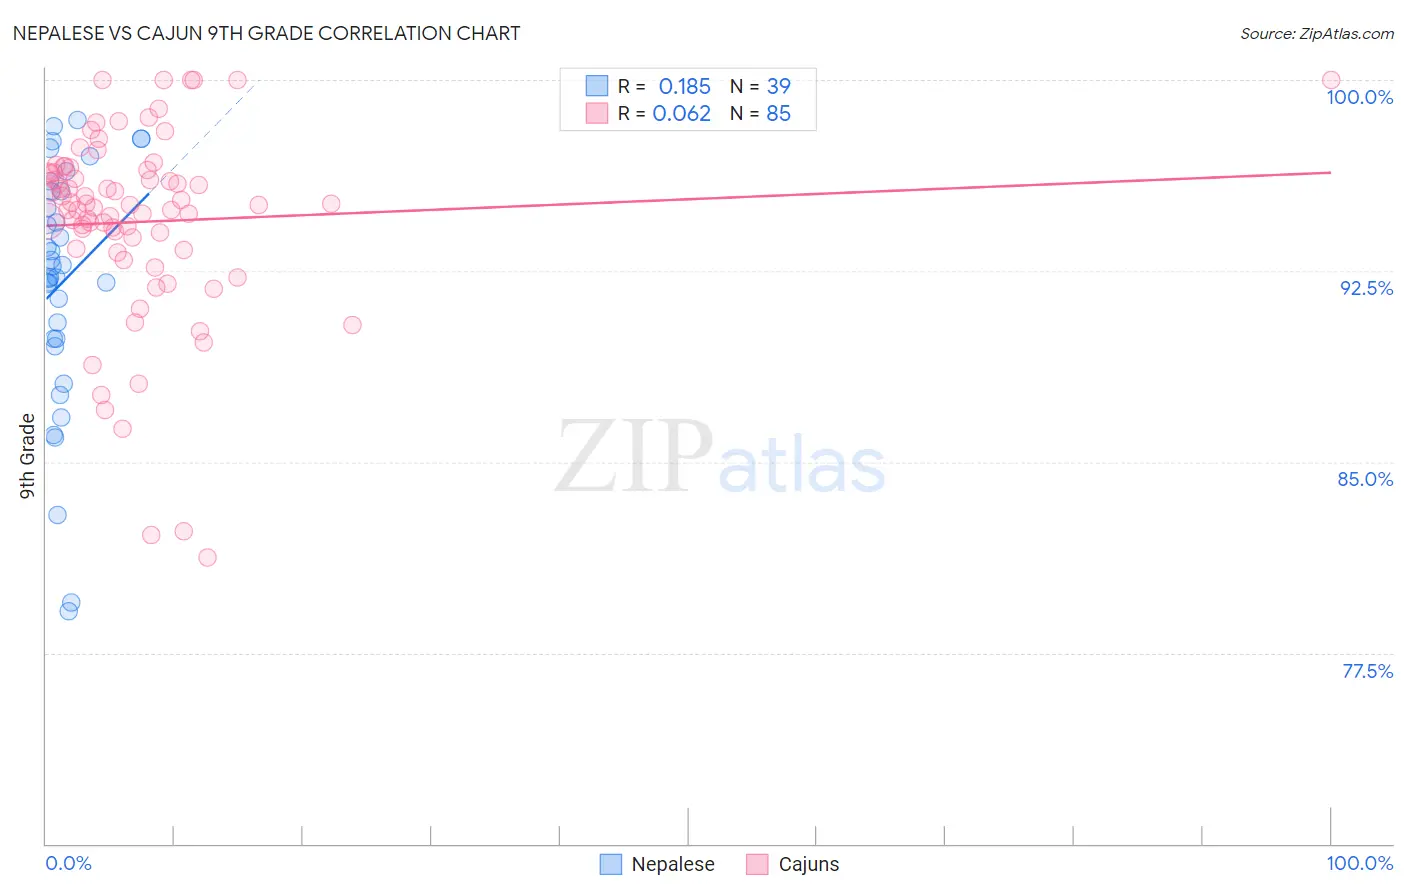
Nepalese vs Cajun 9th Grade Correlation Chart
The statistical analysis conducted on geographies consisting of 24,519,269 people shows a poor positive correlation between the proportion of Nepalese and percentage of population with at least 9th grade education in the United States with a correlation coefficient (R) of 0.185 and weighted average of 92.0%. Similarly, the statistical analysis conducted on geographies consisting of 149,711,516 people shows a slight positive correlation between the proportion of Cajuns and percentage of population with at least 9th grade education in the United States with a correlation coefficient (R) of 0.062 and weighted average of 95.1%, a difference of 3.4%.
9th Grade Correlation Summary
| Measurement | Nepalese | Cajun |
| Minimum | 79.1% | 81.2% |
| Maximum | 98.4% | 100.0% |
| Range | 19.3% | 18.8% |
| Mean | 92.1% | 94.4% |
| Median | 92.7% | 95.1% |
| Interquartile 25% (IQ1) | 89.8% | 93.3% |
| Interquartile 75% (IQ3) | 95.6% | 96.4% |
| Interquartile Range (IQR) | 5.8% | 3.1% |
| Standard Deviation (Sample) | 4.8% | 3.8% |
| Standard Deviation (Population) | 4.7% | 3.8% |
Similar Demographics by 9th Grade
Demographics Similar to Nepalese by 9th Grade
In terms of 9th grade, the demographic groups most similar to Nepalese are Ecuadorian (91.9%, a difference of 0.050%), Nicaraguan (91.9%, a difference of 0.090%), Immigrants from Ecuador (91.8%, a difference of 0.16%), Belizean (91.8%, a difference of 0.19%), and Puerto Rican (91.8%, a difference of 0.19%).
| Demographics | Rating | Rank | 9th Grade |
| Immigrants | Fiji | 0.0 /100 | #311 | Tragic 92.3% |
| Houma | 0.0 /100 | #312 | Tragic 92.3% |
| Vietnamese | 0.0 /100 | #313 | Tragic 92.3% |
| Immigrants | Portugal | 0.0 /100 | #314 | Tragic 92.2% |
| Immigrants | Caribbean | 0.0 /100 | #315 | Tragic 92.2% |
| Cape Verdeans | 0.0 /100 | #316 | Tragic 92.2% |
| Immigrants | Cuba | 0.0 /100 | #317 | Tragic 92.2% |
| Nepalese | 0.0 /100 | #318 | Tragic 92.0% |
| Ecuadorians | 0.0 /100 | #319 | Tragic 91.9% |
| Nicaraguans | 0.0 /100 | #320 | Tragic 91.9% |
| Immigrants | Ecuador | 0.0 /100 | #321 | Tragic 91.8% |
| Belizeans | 0.0 /100 | #322 | Tragic 91.8% |
| Puerto Ricans | 0.0 /100 | #323 | Tragic 91.8% |
| Immigrants | Belize | 0.0 /100 | #324 | Tragic 91.8% |
| Central American Indians | 0.0 /100 | #325 | Tragic 91.5% |
Demographics Similar to Cajuns by 9th Grade
In terms of 9th grade, the demographic groups most similar to Cajuns are Ugandan (95.1%, a difference of 0.0%), Albanian (95.1%, a difference of 0.010%), Immigrants from Korea (95.1%, a difference of 0.020%), Kenyan (95.1%, a difference of 0.020%), and Arab (95.1%, a difference of 0.030%).
| Demographics | Rating | Rank | 9th Grade |
| Yup'ik | 83.3 /100 | #144 | Excellent 95.2% |
| Pueblo | 82.2 /100 | #145 | Excellent 95.1% |
| Immigrants | Sri Lanka | 82.1 /100 | #146 | Excellent 95.1% |
| Choctaw | 81.9 /100 | #147 | Excellent 95.1% |
| Immigrants | Jordan | 81.2 /100 | #148 | Excellent 95.1% |
| Immigrants | Korea | 79.6 /100 | #149 | Good 95.1% |
| Kenyans | 79.1 /100 | #150 | Good 95.1% |
| Cajuns | 77.3 /100 | #151 | Good 95.1% |
| Ugandans | 77.0 /100 | #152 | Good 95.1% |
| Albanians | 76.1 /100 | #153 | Good 95.1% |
| Arabs | 74.9 /100 | #154 | Good 95.1% |
| Immigrants | Kazakhstan | 74.7 /100 | #155 | Good 95.1% |
| Immigrants | Kenya | 73.1 /100 | #156 | Good 95.0% |
| Mongolians | 73.0 /100 | #157 | Good 95.0% |
| Egyptians | 70.1 /100 | #158 | Good 95.0% |