Nepalese vs Immigrants from Oceania Bachelor's Degree
COMPARE
Nepalese
Immigrants from Oceania
Bachelor's Degree
Bachelor's Degree Comparison
Nepalese
Immigrants from Oceania
29.9%
BACHELOR'S DEGREE
0.0/ 100
METRIC RATING
307th/ 347
METRIC RANK
37.3%
BACHELOR'S DEGREE
37.3/ 100
METRIC RATING
188th/ 347
METRIC RANK
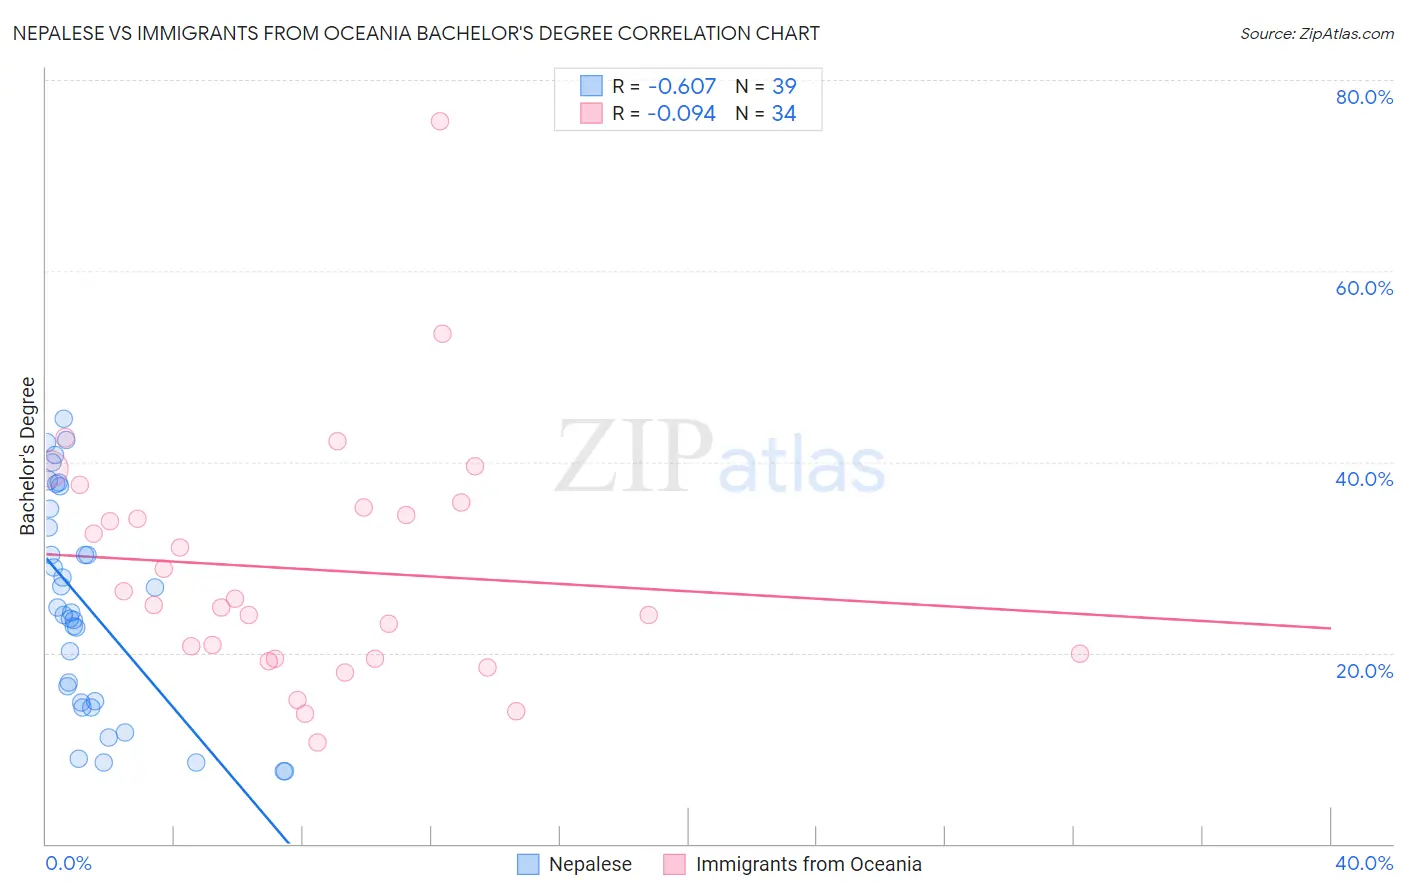
Nepalese vs Immigrants from Oceania Bachelor's Degree Correlation Chart
The statistical analysis conducted on geographies consisting of 24,519,269 people shows a significant negative correlation between the proportion of Nepalese and percentage of population with at least bachelor's degree education in the United States with a correlation coefficient (R) of -0.607 and weighted average of 29.9%. Similarly, the statistical analysis conducted on geographies consisting of 305,508,659 people shows a slight negative correlation between the proportion of Immigrants from Oceania and percentage of population with at least bachelor's degree education in the United States with a correlation coefficient (R) of -0.094 and weighted average of 37.3%, a difference of 25.0%.
Bachelor's Degree Correlation Summary
| Measurement | Nepalese | Immigrants from Oceania |
| Minimum | 7.6% | 10.7% |
| Maximum | 44.5% | 75.7% |
| Range | 36.9% | 65.0% |
| Mean | 24.9% | 28.7% |
| Median | 24.2% | 25.4% |
| Interquartile 25% (IQ1) | 14.8% | 19.4% |
| Interquartile 75% (IQ3) | 35.1% | 35.2% |
| Interquartile Range (IQR) | 20.3% | 15.8% |
| Standard Deviation (Sample) | 11.2% | 12.9% |
| Standard Deviation (Population) | 11.0% | 12.7% |
Similar Demographics by Bachelor's Degree
Demographics Similar to Nepalese by Bachelor's Degree
In terms of bachelor's degree, the demographic groups most similar to Nepalese are Immigrants from Yemen (29.9%, a difference of 0.040%), Immigrants from Latin America (30.1%, a difference of 0.58%), Cajun (29.6%, a difference of 0.86%), Bangladeshi (30.2%, a difference of 1.0%), and Cherokee (30.2%, a difference of 1.0%).
| Demographics | Rating | Rank | Bachelor's Degree |
| Immigrants | Micronesia | 0.0 /100 | #300 | Tragic 30.4% |
| Immigrants | Cuba | 0.0 /100 | #301 | Tragic 30.3% |
| Mexican American Indians | 0.0 /100 | #302 | Tragic 30.2% |
| Bangladeshis | 0.0 /100 | #303 | Tragic 30.2% |
| Cherokee | 0.0 /100 | #304 | Tragic 30.2% |
| Immigrants | Latin America | 0.0 /100 | #305 | Tragic 30.1% |
| Immigrants | Yemen | 0.0 /100 | #306 | Tragic 29.9% |
| Nepalese | 0.0 /100 | #307 | Tragic 29.9% |
| Cajuns | 0.0 /100 | #308 | Tragic 29.6% |
| Hispanics or Latinos | 0.0 /100 | #309 | Tragic 29.6% |
| Cheyenne | 0.0 /100 | #310 | Tragic 29.4% |
| Choctaw | 0.0 /100 | #311 | Tragic 29.4% |
| Seminole | 0.0 /100 | #312 | Tragic 29.4% |
| Alaska Natives | 0.0 /100 | #313 | Tragic 29.4% |
| Shoshone | 0.0 /100 | #314 | Tragic 29.3% |
Demographics Similar to Immigrants from Oceania by Bachelor's Degree
In terms of bachelor's degree, the demographic groups most similar to Immigrants from Oceania are Slovak (37.3%, a difference of 0.050%), English (37.4%, a difference of 0.24%), Norwegian (37.5%, a difference of 0.32%), Swiss (37.2%, a difference of 0.35%), and Nigerian (37.2%, a difference of 0.37%).
| Demographics | Rating | Rank | Bachelor's Degree |
| Immigrants | Senegal | 43.8 /100 | #181 | Average 37.6% |
| Immigrants | Bosnia and Herzegovina | 43.4 /100 | #182 | Average 37.6% |
| Senegalese | 42.2 /100 | #183 | Average 37.5% |
| Scandinavians | 41.7 /100 | #184 | Average 37.5% |
| Immigrants | Peru | 41.3 /100 | #185 | Average 37.5% |
| Norwegians | 40.4 /100 | #186 | Average 37.5% |
| English | 39.7 /100 | #187 | Fair 37.4% |
| Immigrants | Oceania | 37.3 /100 | #188 | Fair 37.3% |
| Slovaks | 36.9 /100 | #189 | Fair 37.3% |
| Swiss | 34.1 /100 | #190 | Fair 37.2% |
| Nigerians | 33.9 /100 | #191 | Fair 37.2% |
| Immigrants | Vietnam | 32.1 /100 | #192 | Fair 37.1% |
| Yugoslavians | 31.5 /100 | #193 | Fair 37.1% |
| Belgians | 29.9 /100 | #194 | Fair 37.0% |
| Koreans | 29.8 /100 | #195 | Fair 37.0% |