Nepalese vs Comanche Unemployment Among Seniors over 75 years
COMPARE
Nepalese
Comanche
Unemployment Among Seniors over 75 years
Unemployment Among Seniors over 75 years Comparison
Nepalese
Comanche
10.1%
UNEMPLOYMENT AMONG SENIORS OVER 75 YEARS
0.0/ 100
METRIC RATING
313th/ 347
METRIC RANK
6.7%
UNEMPLOYMENT AMONG SENIORS OVER 75 YEARS
100.0/ 100
METRIC RATING
12th/ 347
METRIC RANK
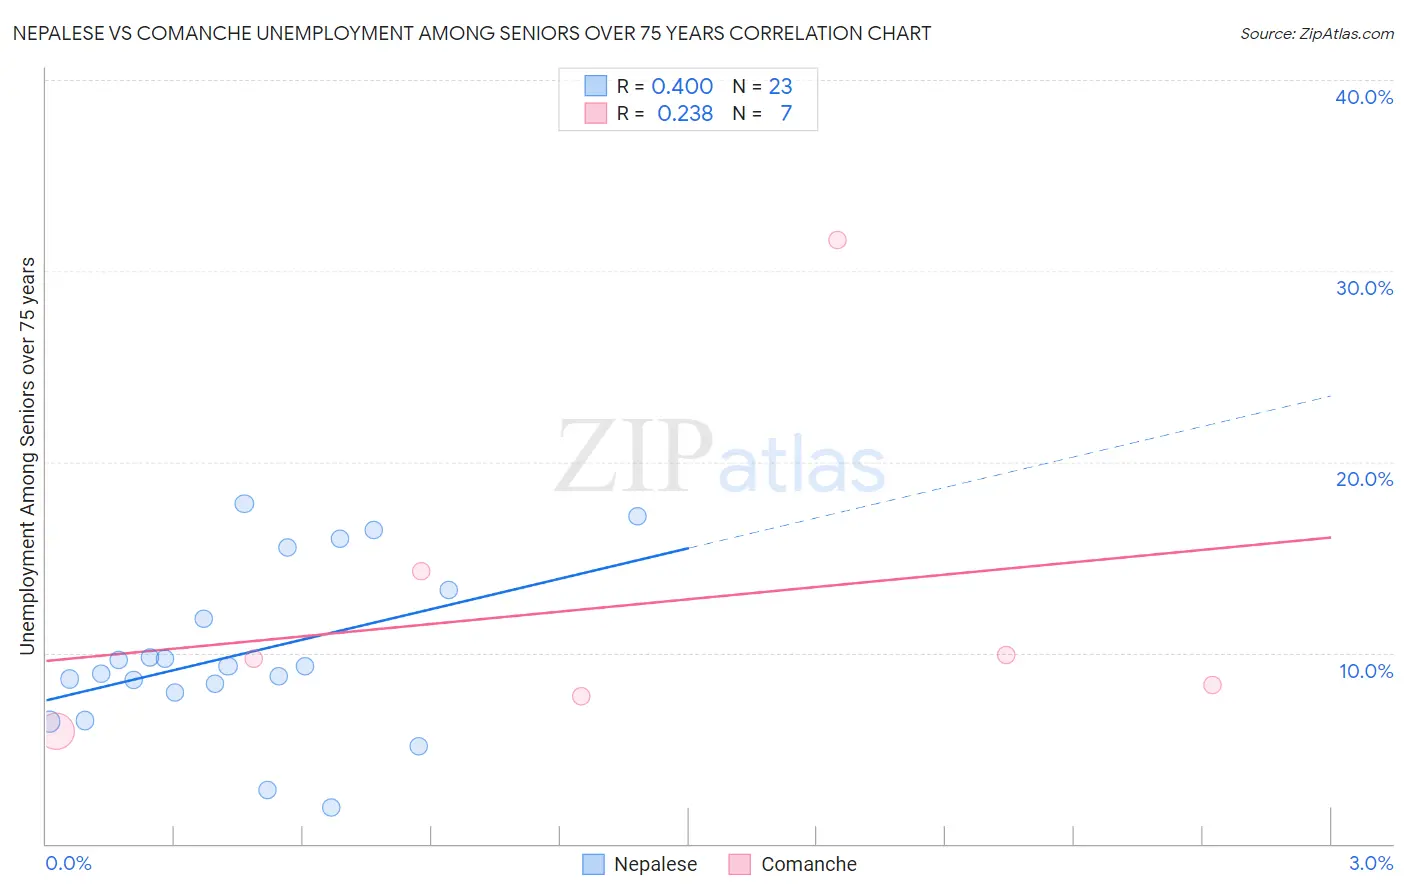
Nepalese vs Comanche Unemployment Among Seniors over 75 years Correlation Chart
The statistical analysis conducted on geographies consisting of 19,385,222 people shows a moderate positive correlation between the proportion of Nepalese and unemployment rate among seniors over the age of 75 in the United States with a correlation coefficient (R) of 0.400 and weighted average of 10.1%. Similarly, the statistical analysis conducted on geographies consisting of 77,452,477 people shows a weak positive correlation between the proportion of Comanche and unemployment rate among seniors over the age of 75 in the United States with a correlation coefficient (R) of 0.238 and weighted average of 6.7%, a difference of 51.5%.
Unemployment Among Seniors over 75 years Correlation Summary
| Measurement | Nepalese | Comanche |
| Minimum | 1.9% | 5.9% |
| Maximum | 17.8% | 31.6% |
| Range | 15.9% | 25.7% |
| Mean | 10.0% | 12.5% |
| Median | 9.3% | 9.7% |
| Interquartile 25% (IQ1) | 7.9% | 7.7% |
| Interquartile 75% (IQ3) | 13.3% | 14.3% |
| Interquartile Range (IQR) | 5.3% | 6.6% |
| Standard Deviation (Sample) | 4.3% | 8.8% |
| Standard Deviation (Population) | 4.2% | 8.2% |
Similar Demographics by Unemployment Among Seniors over 75 years
Demographics Similar to Nepalese by Unemployment Among Seniors over 75 years
In terms of unemployment among seniors over 75 years, the demographic groups most similar to Nepalese are Chippewa (10.1%, a difference of 0.12%), Scottish (10.1%, a difference of 0.13%), Hungarian (10.1%, a difference of 0.25%), English (10.1%, a difference of 0.43%), and Dutch West Indian (10.2%, a difference of 0.45%).
| Demographics | Rating | Rank | Unemployment Among Seniors over 75 years |
| Italians | 0.0 /100 | #306 | Tragic 10.0% |
| Immigrants | Fiji | 0.0 /100 | #307 | Tragic 10.0% |
| Whites/Caucasians | 0.0 /100 | #308 | Tragic 10.1% |
| English | 0.0 /100 | #309 | Tragic 10.1% |
| Hungarians | 0.0 /100 | #310 | Tragic 10.1% |
| Scottish | 0.0 /100 | #311 | Tragic 10.1% |
| Chippewa | 0.0 /100 | #312 | Tragic 10.1% |
| Nepalese | 0.0 /100 | #313 | Tragic 10.1% |
| Dutch West Indians | 0.0 /100 | #314 | Tragic 10.2% |
| Pennsylvania Germans | 0.0 /100 | #315 | Tragic 10.2% |
| Natives/Alaskans | 0.0 /100 | #316 | Tragic 10.2% |
| Irish | 0.0 /100 | #317 | Tragic 10.2% |
| Liberians | 0.0 /100 | #318 | Tragic 10.2% |
| Germans | 0.0 /100 | #319 | Tragic 10.3% |
| French | 0.0 /100 | #320 | Tragic 10.3% |
Demographics Similar to Comanche by Unemployment Among Seniors over 75 years
In terms of unemployment among seniors over 75 years, the demographic groups most similar to Comanche are Immigrants from Grenada (6.7%, a difference of 0.14%), Yuman (6.7%, a difference of 0.23%), Soviet Union (6.6%, a difference of 0.45%), Immigrants from Congo (6.7%, a difference of 0.81%), and Taiwanese (6.6%, a difference of 1.7%).
| Demographics | Rating | Rank | Unemployment Among Seniors over 75 years |
| Hopi | 100.0 /100 | #5 | Exceptional 6.3% |
| Immigrants | Armenia | 100.0 /100 | #6 | Exceptional 6.5% |
| Spanish American Indians | 100.0 /100 | #7 | Exceptional 6.5% |
| Taiwanese | 100.0 /100 | #8 | Exceptional 6.6% |
| Soviet Union | 100.0 /100 | #9 | Exceptional 6.6% |
| Yuman | 100.0 /100 | #10 | Exceptional 6.7% |
| Immigrants | Grenada | 100.0 /100 | #11 | Exceptional 6.7% |
| Comanche | 100.0 /100 | #12 | Exceptional 6.7% |
| Immigrants | Congo | 100.0 /100 | #13 | Exceptional 6.7% |
| Ute | 100.0 /100 | #14 | Exceptional 6.8% |
| Icelanders | 100.0 /100 | #15 | Exceptional 7.0% |
| Seminole | 100.0 /100 | #16 | Exceptional 7.1% |
| Immigrants | Switzerland | 100.0 /100 | #17 | Exceptional 7.2% |
| Immigrants | Uzbekistan | 100.0 /100 | #18 | Exceptional 7.2% |
| Immigrants | Zaire | 100.0 /100 | #19 | Exceptional 7.2% |