Immigrants from Kuwait vs Cheyenne 9th Grade
COMPARE
Immigrants from Kuwait
Cheyenne
9th Grade
9th Grade Comparison
Immigrants from Kuwait
Cheyenne
95.4%
9TH GRADE
95.5/ 100
METRIC RATING
122nd/ 347
METRIC RANK
94.9%
9TH GRADE
51.5/ 100
METRIC RATING
173rd/ 347
METRIC RANK
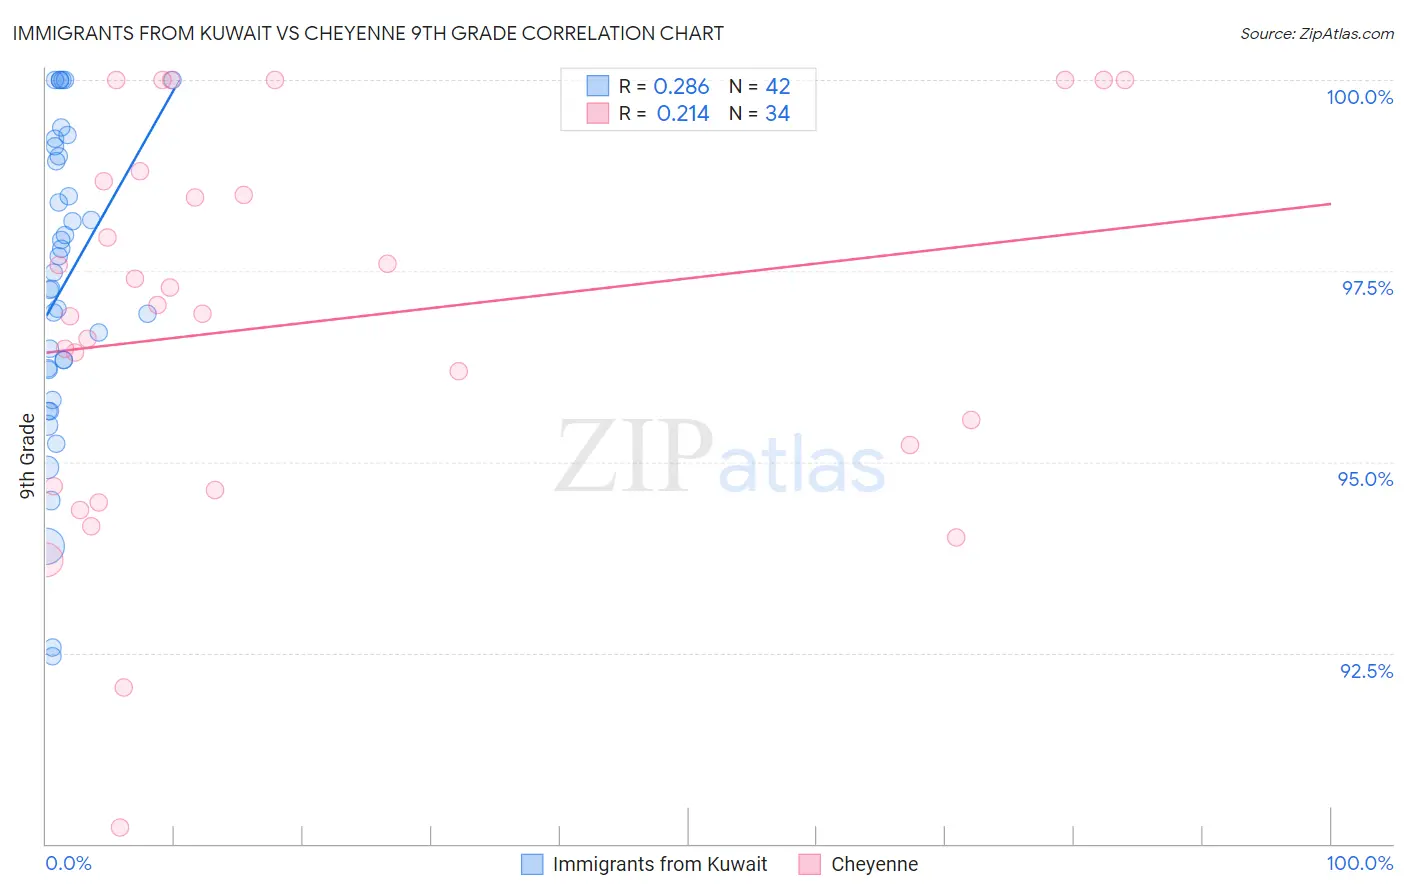
Immigrants from Kuwait vs Cheyenne 9th Grade Correlation Chart
The statistical analysis conducted on geographies consisting of 136,913,666 people shows a weak positive correlation between the proportion of Immigrants from Kuwait and percentage of population with at least 9th grade education in the United States with a correlation coefficient (R) of 0.286 and weighted average of 95.4%. Similarly, the statistical analysis conducted on geographies consisting of 80,719,411 people shows a weak positive correlation between the proportion of Cheyenne and percentage of population with at least 9th grade education in the United States with a correlation coefficient (R) of 0.214 and weighted average of 94.9%, a difference of 0.55%.
9th Grade Correlation Summary
| Measurement | Immigrants from Kuwait | Cheyenne |
| Minimum | 92.5% | 90.2% |
| Maximum | 100.0% | 100.0% |
| Range | 7.5% | 9.8% |
| Mean | 97.3% | 96.8% |
| Median | 97.4% | 97.0% |
| Interquartile 25% (IQ1) | 96.2% | 94.7% |
| Interquartile 75% (IQ3) | 99.0% | 98.7% |
| Interquartile Range (IQR) | 2.8% | 4.0% |
| Standard Deviation (Sample) | 2.0% | 2.5% |
| Standard Deviation (Population) | 2.0% | 2.4% |
Similar Demographics by 9th Grade
Demographics Similar to Immigrants from Kuwait by 9th Grade
In terms of 9th grade, the demographic groups most similar to Immigrants from Kuwait are Immigrants from Romania (95.4%, a difference of 0.0%), Immigrants from Turkey (95.4%, a difference of 0.0%), Soviet Union (95.4%, a difference of 0.0%), Cambodian (95.4%, a difference of 0.0%), and Cree (95.4%, a difference of 0.0%).
| Demographics | Rating | Rank | 9th Grade |
| Burmese | 96.0 /100 | #115 | Exceptional 95.4% |
| Immigrants | Europe | 95.7 /100 | #116 | Exceptional 95.4% |
| Immigrants | Romania | 95.6 /100 | #117 | Exceptional 95.4% |
| Immigrants | Turkey | 95.6 /100 | #118 | Exceptional 95.4% |
| Soviet Union | 95.6 /100 | #119 | Exceptional 95.4% |
| Cambodians | 95.6 /100 | #120 | Exceptional 95.4% |
| Cree | 95.5 /100 | #121 | Exceptional 95.4% |
| Immigrants | Kuwait | 95.5 /100 | #122 | Exceptional 95.4% |
| Kiowa | 95.3 /100 | #123 | Exceptional 95.4% |
| Shoshone | 95.3 /100 | #124 | Exceptional 95.4% |
| Immigrants | South Central Asia | 95.1 /100 | #125 | Exceptional 95.4% |
| Immigrants | Serbia | 94.4 /100 | #126 | Exceptional 95.4% |
| Palestinians | 94.3 /100 | #127 | Exceptional 95.4% |
| Immigrants | Hungary | 94.2 /100 | #128 | Exceptional 95.4% |
| Basques | 94.1 /100 | #129 | Exceptional 95.4% |
Demographics Similar to Cheyenne by 9th Grade
In terms of 9th grade, the demographic groups most similar to Cheyenne are Immigrants from Egypt (94.9%, a difference of 0.010%), Brazilian (94.9%, a difference of 0.010%), Iraqi (94.9%, a difference of 0.020%), Immigrants from Spain (94.9%, a difference of 0.020%), and Immigrants from Iraq (94.9%, a difference of 0.030%).
| Demographics | Rating | Rank | 9th Grade |
| Ute | 62.6 /100 | #166 | Good 95.0% |
| Immigrants | Brazil | 61.1 /100 | #167 | Good 95.0% |
| Chileans | 60.7 /100 | #168 | Good 95.0% |
| Spaniards | 59.6 /100 | #169 | Average 94.9% |
| Alsatians | 58.6 /100 | #170 | Average 94.9% |
| Colville | 58.5 /100 | #171 | Average 94.9% |
| Iraqis | 54.0 /100 | #172 | Average 94.9% |
| Cheyenne | 51.5 /100 | #173 | Average 94.9% |
| Immigrants | Egypt | 50.0 /100 | #174 | Average 94.9% |
| Brazilians | 49.8 /100 | #175 | Average 94.9% |
| Immigrants | Spain | 49.1 /100 | #176 | Average 94.9% |
| Immigrants | Iraq | 47.8 /100 | #177 | Average 94.9% |
| Immigrants | Poland | 46.7 /100 | #178 | Average 94.9% |
| Immigrants | Venezuela | 46.5 /100 | #179 | Average 94.9% |
| Immigrants | Uganda | 43.1 /100 | #180 | Average 94.8% |