Immigrants from Middle Africa vs Cajun 9th Grade
COMPARE
Immigrants from Middle Africa
Cajun
9th Grade
9th Grade Comparison
Immigrants from Middle Africa
Cajuns
94.2%
9TH GRADE
2.2/ 100
METRIC RATING
242nd/ 347
METRIC RANK
95.1%
9TH GRADE
77.3/ 100
METRIC RATING
151st/ 347
METRIC RANK
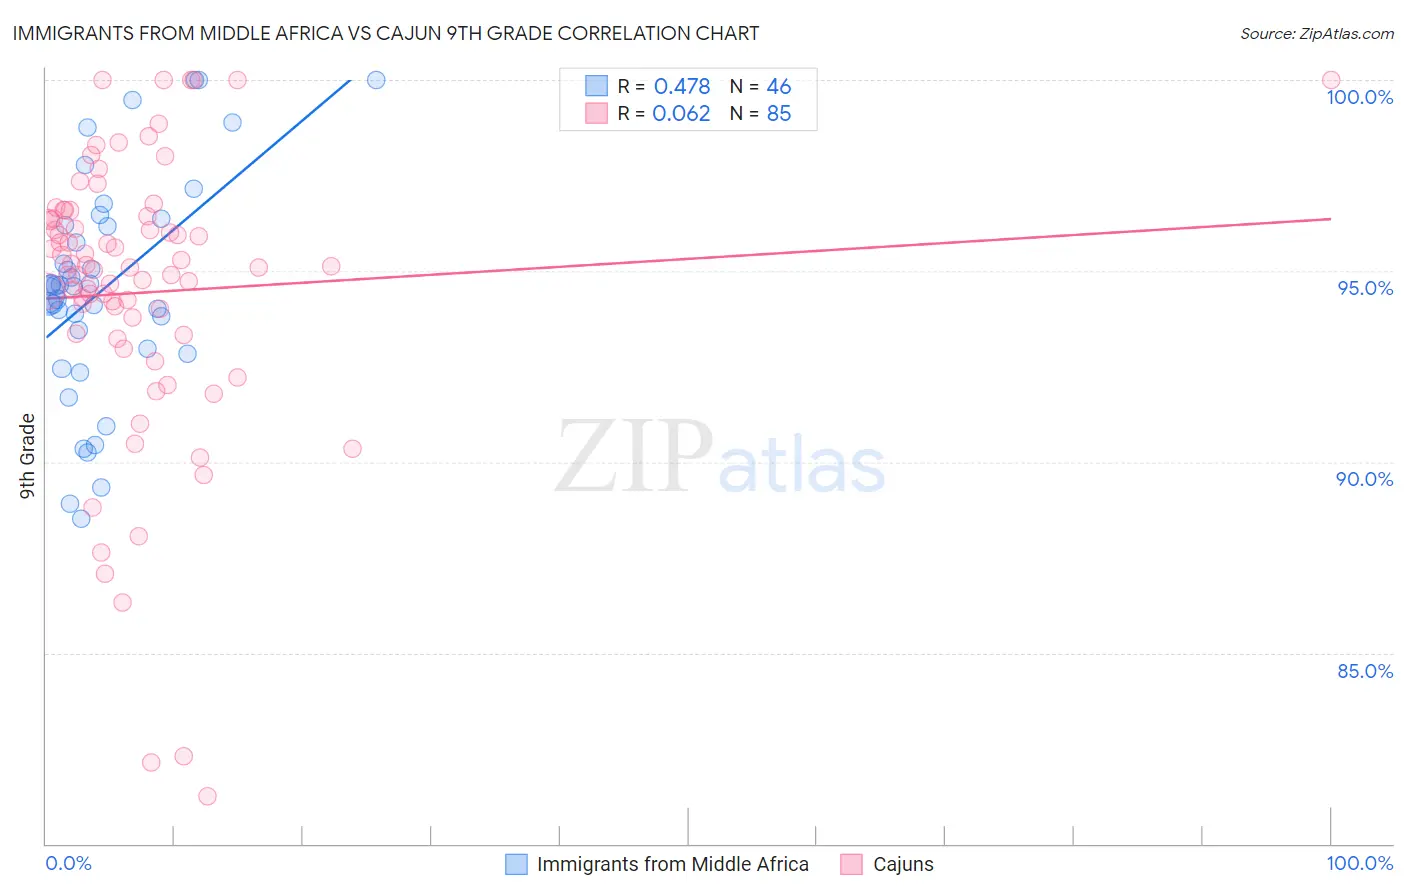
Immigrants from Middle Africa vs Cajun 9th Grade Correlation Chart
The statistical analysis conducted on geographies consisting of 202,699,867 people shows a moderate positive correlation between the proportion of Immigrants from Middle Africa and percentage of population with at least 9th grade education in the United States with a correlation coefficient (R) of 0.478 and weighted average of 94.2%. Similarly, the statistical analysis conducted on geographies consisting of 149,711,516 people shows a slight positive correlation between the proportion of Cajuns and percentage of population with at least 9th grade education in the United States with a correlation coefficient (R) of 0.062 and weighted average of 95.1%, a difference of 0.93%.
9th Grade Correlation Summary
| Measurement | Immigrants from Middle Africa | Cajun |
| Minimum | 88.5% | 81.2% |
| Maximum | 100.0% | 100.0% |
| Range | 11.5% | 18.8% |
| Mean | 94.5% | 94.4% |
| Median | 94.6% | 95.1% |
| Interquartile 25% (IQ1) | 93.0% | 93.3% |
| Interquartile 75% (IQ3) | 96.2% | 96.4% |
| Interquartile Range (IQR) | 3.2% | 3.1% |
| Standard Deviation (Sample) | 2.9% | 3.8% |
| Standard Deviation (Population) | 2.9% | 3.8% |
Similar Demographics by 9th Grade
Demographics Similar to Immigrants from Middle Africa by 9th Grade
In terms of 9th grade, the demographic groups most similar to Immigrants from Middle Africa are Immigrants from Cameroon (94.2%, a difference of 0.0%), Dutch West Indian (94.2%, a difference of 0.010%), Paiute (94.2%, a difference of 0.020%), Senegalese (94.2%, a difference of 0.020%), and Afghan (94.2%, a difference of 0.030%).
| Demographics | Rating | Rank | 9th Grade |
| Bolivians | 3.3 /100 | #235 | Tragic 94.3% |
| Somalis | 2.9 /100 | #236 | Tragic 94.3% |
| Koreans | 2.9 /100 | #237 | Tragic 94.3% |
| South American Indians | 2.8 /100 | #238 | Tragic 94.3% |
| Immigrants | China | 2.8 /100 | #239 | Tragic 94.3% |
| Immigrants | Ethiopia | 2.7 /100 | #240 | Tragic 94.3% |
| Spanish Americans | 2.6 /100 | #241 | Tragic 94.2% |
| Immigrants | Middle Africa | 2.2 /100 | #242 | Tragic 94.2% |
| Immigrants | Cameroon | 2.1 /100 | #243 | Tragic 94.2% |
| Dutch West Indians | 2.0 /100 | #244 | Tragic 94.2% |
| Paiute | 1.9 /100 | #245 | Tragic 94.2% |
| Senegalese | 1.9 /100 | #246 | Tragic 94.2% |
| Afghans | 1.8 /100 | #247 | Tragic 94.2% |
| Immigrants | Somalia | 1.4 /100 | #248 | Tragic 94.1% |
| Uruguayans | 1.3 /100 | #249 | Tragic 94.1% |
Demographics Similar to Cajuns by 9th Grade
In terms of 9th grade, the demographic groups most similar to Cajuns are Ugandan (95.1%, a difference of 0.0%), Albanian (95.1%, a difference of 0.010%), Immigrants from Korea (95.1%, a difference of 0.020%), Kenyan (95.1%, a difference of 0.020%), and Arab (95.1%, a difference of 0.030%).
| Demographics | Rating | Rank | 9th Grade |
| Yup'ik | 83.3 /100 | #144 | Excellent 95.2% |
| Pueblo | 82.2 /100 | #145 | Excellent 95.1% |
| Immigrants | Sri Lanka | 82.1 /100 | #146 | Excellent 95.1% |
| Choctaw | 81.9 /100 | #147 | Excellent 95.1% |
| Immigrants | Jordan | 81.2 /100 | #148 | Excellent 95.1% |
| Immigrants | Korea | 79.6 /100 | #149 | Good 95.1% |
| Kenyans | 79.1 /100 | #150 | Good 95.1% |
| Cajuns | 77.3 /100 | #151 | Good 95.1% |
| Ugandans | 77.0 /100 | #152 | Good 95.1% |
| Albanians | 76.1 /100 | #153 | Good 95.1% |
| Arabs | 74.9 /100 | #154 | Good 95.1% |
| Immigrants | Kazakhstan | 74.7 /100 | #155 | Good 95.1% |
| Immigrants | Kenya | 73.1 /100 | #156 | Good 95.0% |
| Mongolians | 73.0 /100 | #157 | Good 95.0% |
| Egyptians | 70.1 /100 | #158 | Good 95.0% |