Immigrants from Chile vs Cajun 9th Grade
COMPARE
Immigrants from Chile
Cajun
9th Grade
9th Grade Comparison
Immigrants from Chile
Cajuns
94.5%
9TH GRADE
13.4/ 100
METRIC RATING
210th/ 347
METRIC RANK
95.1%
9TH GRADE
77.3/ 100
METRIC RATING
151st/ 347
METRIC RANK
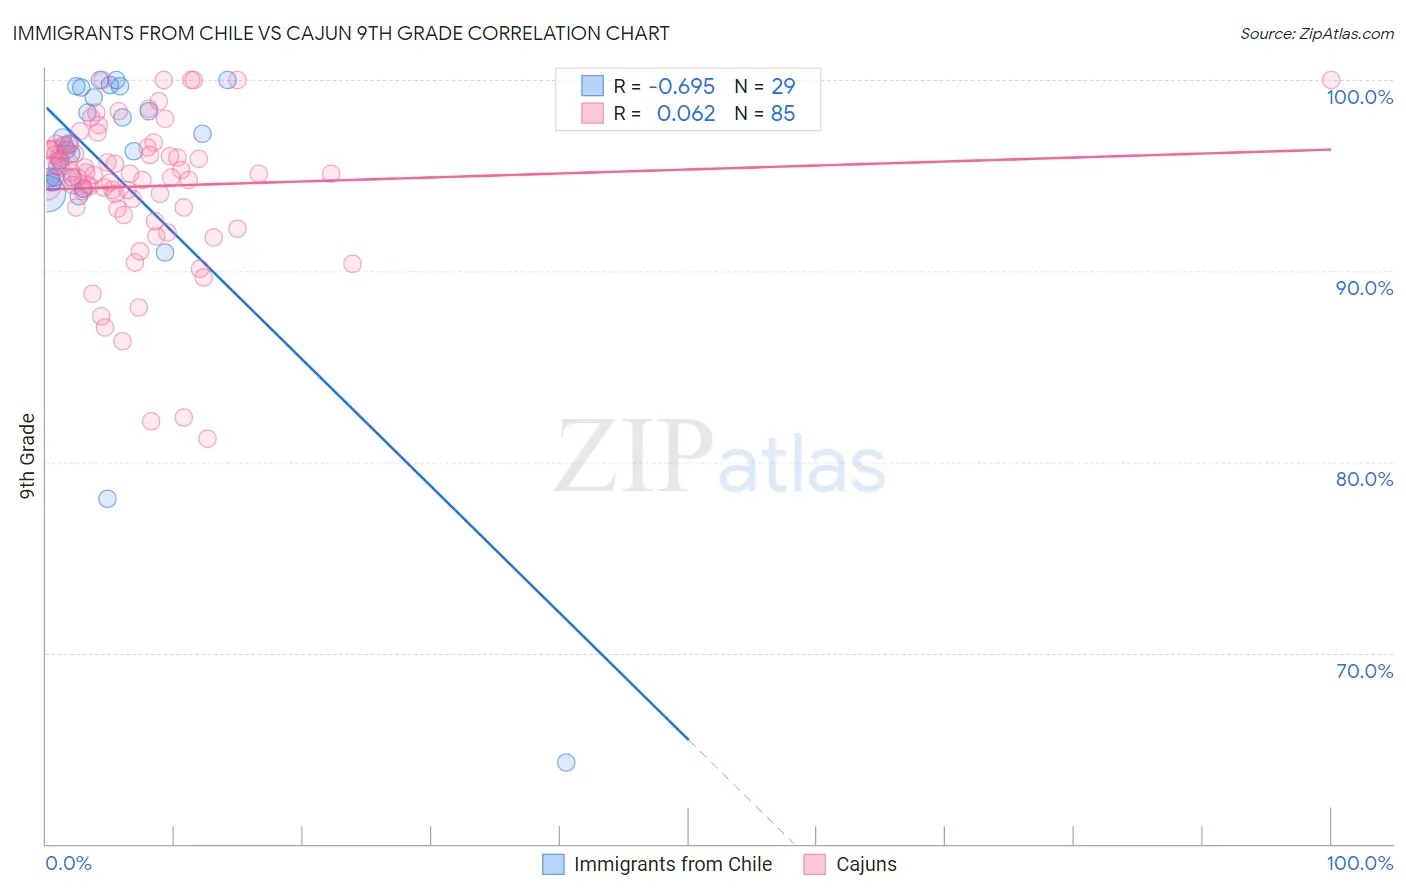
Immigrants from Chile vs Cajun 9th Grade Correlation Chart
The statistical analysis conducted on geographies consisting of 218,647,266 people shows a significant negative correlation between the proportion of Immigrants from Chile and percentage of population with at least 9th grade education in the United States with a correlation coefficient (R) of -0.695 and weighted average of 94.5%. Similarly, the statistical analysis conducted on geographies consisting of 149,711,516 people shows a slight positive correlation between the proportion of Cajuns and percentage of population with at least 9th grade education in the United States with a correlation coefficient (R) of 0.062 and weighted average of 95.1%, a difference of 0.57%.
9th Grade Correlation Summary
| Measurement | Immigrants from Chile | Cajun |
| Minimum | 64.3% | 81.2% |
| Maximum | 100.0% | 100.0% |
| Range | 35.7% | 18.8% |
| Mean | 95.1% | 94.4% |
| Median | 96.3% | 95.1% |
| Interquartile 25% (IQ1) | 94.8% | 93.3% |
| Interquartile 75% (IQ3) | 99.4% | 96.4% |
| Interquartile Range (IQR) | 4.6% | 3.1% |
| Standard Deviation (Sample) | 7.3% | 3.8% |
| Standard Deviation (Population) | 7.1% | 3.8% |
Similar Demographics by 9th Grade
Demographics Similar to Immigrants from Chile by 9th Grade
In terms of 9th grade, the demographic groups most similar to Immigrants from Chile are Comanche (94.6%, a difference of 0.020%), Immigrants from Indonesia (94.5%, a difference of 0.020%), Immigrants from Malaysia (94.5%, a difference of 0.020%), Immigrants from Oceania (94.5%, a difference of 0.020%), and Immigrants from Pakistan (94.6%, a difference of 0.030%).
| Demographics | Rating | Rank | 9th Grade |
| Immigrants | Bahamas | 19.8 /100 | #203 | Poor 94.6% |
| Moroccans | 19.6 /100 | #204 | Poor 94.6% |
| Immigrants | Sudan | 17.6 /100 | #205 | Poor 94.6% |
| Samoans | 17.3 /100 | #206 | Poor 94.6% |
| Immigrants | Morocco | 16.3 /100 | #207 | Poor 94.6% |
| Immigrants | Pakistan | 15.5 /100 | #208 | Poor 94.6% |
| Comanche | 14.9 /100 | #209 | Poor 94.6% |
| Immigrants | Chile | 13.4 /100 | #210 | Poor 94.5% |
| Immigrants | Indonesia | 12.3 /100 | #211 | Poor 94.5% |
| Immigrants | Malaysia | 12.2 /100 | #212 | Poor 94.5% |
| Immigrants | Oceania | 12.1 /100 | #213 | Poor 94.5% |
| Immigrants | Liberia | 11.8 /100 | #214 | Poor 94.5% |
| Immigrants | Syria | 11.0 /100 | #215 | Poor 94.5% |
| Immigrants | Western Asia | 10.7 /100 | #216 | Poor 94.5% |
| Asians | 9.9 /100 | #217 | Tragic 94.5% |
Demographics Similar to Cajuns by 9th Grade
In terms of 9th grade, the demographic groups most similar to Cajuns are Ugandan (95.1%, a difference of 0.0%), Albanian (95.1%, a difference of 0.010%), Immigrants from Korea (95.1%, a difference of 0.020%), Kenyan (95.1%, a difference of 0.020%), and Arab (95.1%, a difference of 0.030%).
| Demographics | Rating | Rank | 9th Grade |
| Yup'ik | 83.3 /100 | #144 | Excellent 95.2% |
| Pueblo | 82.2 /100 | #145 | Excellent 95.1% |
| Immigrants | Sri Lanka | 82.1 /100 | #146 | Excellent 95.1% |
| Choctaw | 81.9 /100 | #147 | Excellent 95.1% |
| Immigrants | Jordan | 81.2 /100 | #148 | Excellent 95.1% |
| Immigrants | Korea | 79.6 /100 | #149 | Good 95.1% |
| Kenyans | 79.1 /100 | #150 | Good 95.1% |
| Cajuns | 77.3 /100 | #151 | Good 95.1% |
| Ugandans | 77.0 /100 | #152 | Good 95.1% |
| Albanians | 76.1 /100 | #153 | Good 95.1% |
| Arabs | 74.9 /100 | #154 | Good 95.1% |
| Immigrants | Kazakhstan | 74.7 /100 | #155 | Good 95.1% |
| Immigrants | Kenya | 73.1 /100 | #156 | Good 95.0% |
| Mongolians | 73.0 /100 | #157 | Good 95.0% |
| Egyptians | 70.1 /100 | #158 | Good 95.0% |