Lithuanian vs Immigrants from France 9th Grade
COMPARE
Lithuanian
Immigrants from France
9th Grade
9th Grade Comparison
Lithuanians
Immigrants from France
96.6%
9TH GRADE
100.0/ 100
METRIC RATING
10th/ 347
METRIC RANK
95.5%
9TH GRADE
97.4/ 100
METRIC RATING
105th/ 347
METRIC RANK
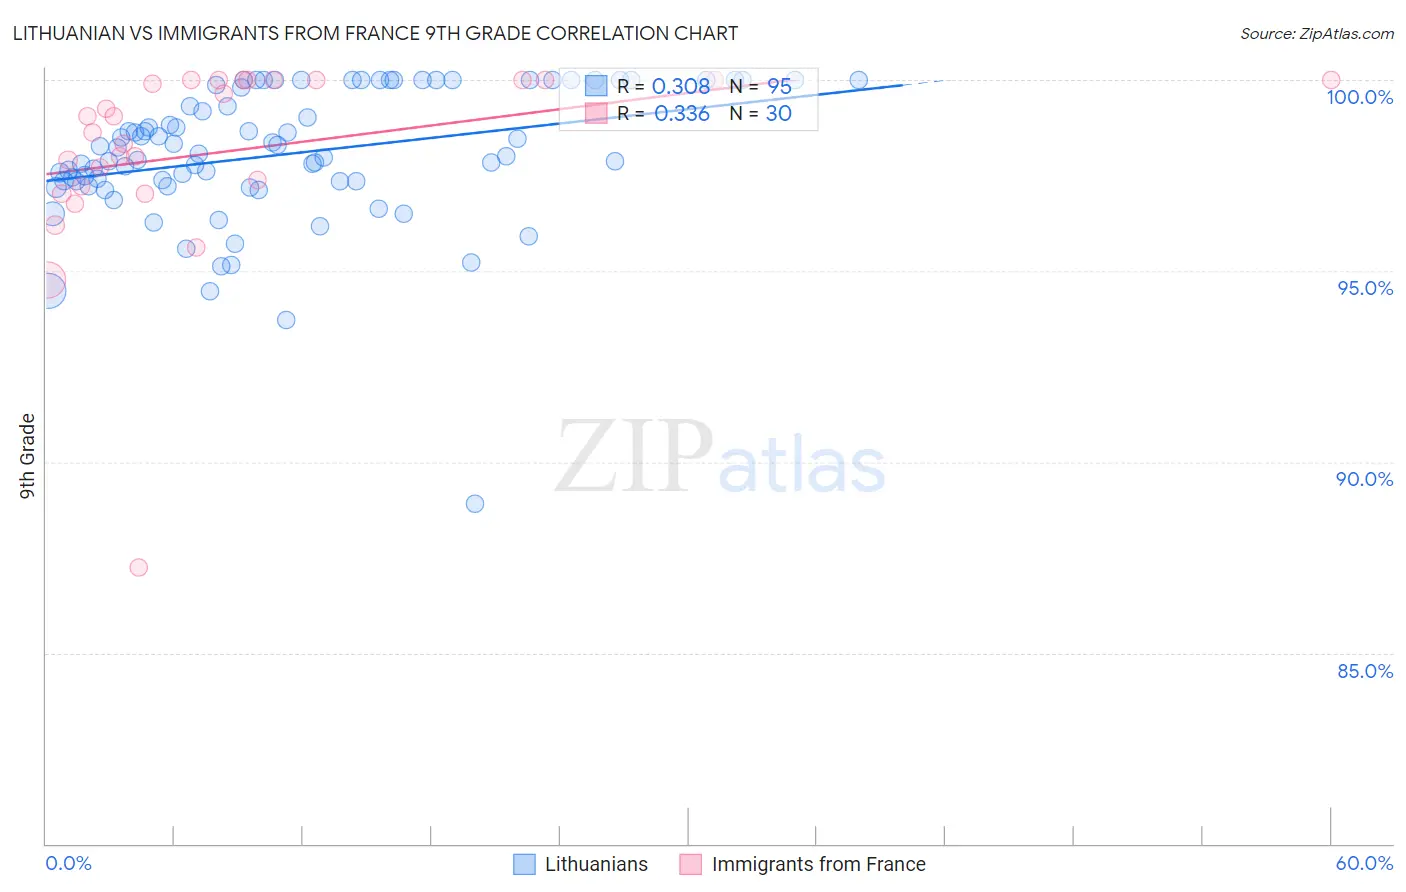
Lithuanian vs Immigrants from France 9th Grade Correlation Chart
The statistical analysis conducted on geographies consisting of 421,947,524 people shows a mild positive correlation between the proportion of Lithuanians and percentage of population with at least 9th grade education in the United States with a correlation coefficient (R) of 0.308 and weighted average of 96.6%. Similarly, the statistical analysis conducted on geographies consisting of 287,920,814 people shows a mild positive correlation between the proportion of Immigrants from France and percentage of population with at least 9th grade education in the United States with a correlation coefficient (R) of 0.336 and weighted average of 95.5%, a difference of 1.1%.
9th Grade Correlation Summary
| Measurement | Lithuanian | Immigrants from France |
| Minimum | 88.9% | 87.2% |
| Maximum | 100.0% | 100.0% |
| Range | 11.1% | 12.8% |
| Mean | 98.1% | 98.2% |
| Median | 98.1% | 98.8% |
| Interquartile 25% (IQ1) | 97.3% | 97.2% |
| Interquartile 75% (IQ3) | 100.0% | 100.0% |
| Interquartile Range (IQR) | 2.7% | 2.8% |
| Standard Deviation (Sample) | 1.8% | 2.6% |
| Standard Deviation (Population) | 1.8% | 2.5% |
Similar Demographics by 9th Grade
Demographics Similar to Lithuanians by 9th Grade
In terms of 9th grade, the demographic groups most similar to Lithuanians are Finnish (96.6%, a difference of 0.0%), English (96.6%, a difference of 0.020%), Tlingit-Haida (96.6%, a difference of 0.040%), Danish (96.5%, a difference of 0.070%), and Scottish (96.5%, a difference of 0.070%).
| Demographics | Rating | Rank | 9th Grade |
| Slovaks | 100.0 /100 | #3 | Exceptional 96.9% |
| Slovenes | 100.0 /100 | #4 | Exceptional 96.7% |
| Swedes | 100.0 /100 | #5 | Exceptional 96.7% |
| Poles | 100.0 /100 | #6 | Exceptional 96.7% |
| Carpatho Rusyns | 100.0 /100 | #7 | Exceptional 96.7% |
| Germans | 100.0 /100 | #8 | Exceptional 96.7% |
| Tlingit-Haida | 100.0 /100 | #9 | Exceptional 96.6% |
| Lithuanians | 100.0 /100 | #10 | Exceptional 96.6% |
| Finns | 100.0 /100 | #11 | Exceptional 96.6% |
| English | 100.0 /100 | #12 | Exceptional 96.6% |
| Danes | 100.0 /100 | #13 | Exceptional 96.5% |
| Scottish | 100.0 /100 | #14 | Exceptional 96.5% |
| Irish | 100.0 /100 | #15 | Exceptional 96.5% |
| Croatians | 100.0 /100 | #16 | Exceptional 96.5% |
| Dutch | 100.0 /100 | #17 | Exceptional 96.5% |
Demographics Similar to Immigrants from France by 9th Grade
In terms of 9th grade, the demographic groups most similar to Immigrants from France are Syrian (95.5%, a difference of 0.0%), Immigrants from Norway (95.5%, a difference of 0.010%), Potawatomi (95.5%, a difference of 0.020%), Immigrants from Switzerland (95.5%, a difference of 0.030%), and Immigrants from Zimbabwe (95.5%, a difference of 0.030%).
| Demographics | Rating | Rank | 9th Grade |
| Immigrants | Japan | 98.4 /100 | #98 | Exceptional 95.6% |
| Menominee | 98.3 /100 | #99 | Exceptional 95.6% |
| Lebanese | 98.1 /100 | #100 | Exceptional 95.6% |
| Immigrants | Moldova | 97.9 /100 | #101 | Exceptional 95.5% |
| Immigrants | Switzerland | 97.7 /100 | #102 | Exceptional 95.5% |
| Potawatomi | 97.7 /100 | #103 | Exceptional 95.5% |
| Syrians | 97.4 /100 | #104 | Exceptional 95.5% |
| Immigrants | France | 97.4 /100 | #105 | Exceptional 95.5% |
| Immigrants | Norway | 97.1 /100 | #106 | Exceptional 95.5% |
| Immigrants | Zimbabwe | 96.9 /100 | #107 | Exceptional 95.5% |
| Chickasaw | 96.8 /100 | #108 | Exceptional 95.5% |
| Osage | 96.8 /100 | #109 | Exceptional 95.5% |
| Immigrants | Bulgaria | 96.7 /100 | #110 | Exceptional 95.5% |
| Cherokee | 96.3 /100 | #111 | Exceptional 95.4% |
| Immigrants | Croatia | 96.2 /100 | #112 | Exceptional 95.4% |