Immigrants from Uruguay vs Immigrants from Bosnia and Herzegovina 11th Grade
COMPARE
Immigrants from Uruguay
Immigrants from Bosnia and Herzegovina
11th Grade
11th Grade Comparison
Immigrants from Uruguay
Immigrants from Bosnia and Herzegovina
91.3%
11TH GRADE
0.5/ 100
METRIC RATING
262nd/ 347
METRIC RANK
93.0%
11TH GRADE
89.0/ 100
METRIC RATING
132nd/ 347
METRIC RANK
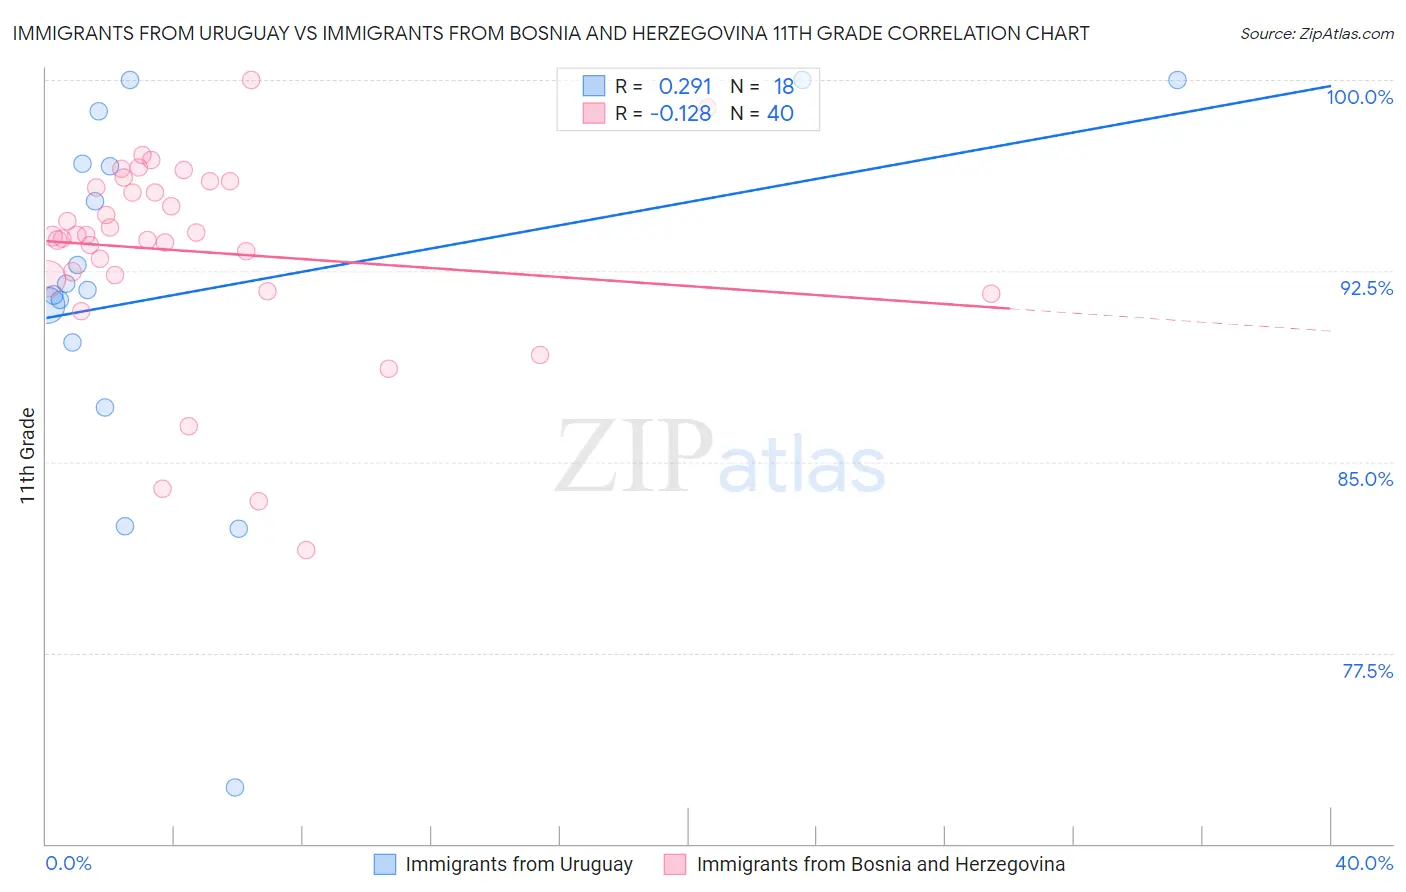
Immigrants from Uruguay vs Immigrants from Bosnia and Herzegovina 11th Grade Correlation Chart
The statistical analysis conducted on geographies consisting of 133,259,667 people shows a weak positive correlation between the proportion of Immigrants from Uruguay and percentage of population with at least 11th grade education in the United States with a correlation coefficient (R) of 0.291 and weighted average of 91.3%. Similarly, the statistical analysis conducted on geographies consisting of 156,819,615 people shows a poor negative correlation between the proportion of Immigrants from Bosnia and Herzegovina and percentage of population with at least 11th grade education in the United States with a correlation coefficient (R) of -0.128 and weighted average of 93.0%, a difference of 1.8%.
11th Grade Correlation Summary
| Measurement | Immigrants from Uruguay | Immigrants from Bosnia and Herzegovina |
| Minimum | 72.2% | 81.5% |
| Maximum | 100.0% | 100.0% |
| Range | 27.8% | 18.5% |
| Mean | 91.8% | 93.3% |
| Median | 91.9% | 93.9% |
| Interquartile 25% (IQ1) | 89.7% | 92.3% |
| Interquartile 75% (IQ3) | 96.7% | 95.9% |
| Interquartile Range (IQR) | 7.0% | 3.6% |
| Standard Deviation (Sample) | 7.3% | 3.9% |
| Standard Deviation (Population) | 7.1% | 3.9% |
Similar Demographics by 11th Grade
Demographics Similar to Immigrants from Uruguay by 11th Grade
In terms of 11th grade, the demographic groups most similar to Immigrants from Uruguay are Taiwanese (91.3%, a difference of 0.010%), Spanish American (91.4%, a difference of 0.020%), Jamaican (91.4%, a difference of 0.030%), Immigrants from Colombia (91.4%, a difference of 0.040%), and Immigrants from Senegal (91.4%, a difference of 0.060%).
| Demographics | Rating | Rank | 11th Grade |
| Blacks/African Americans | 0.7 /100 | #255 | Tragic 91.4% |
| Immigrants | Senegal | 0.7 /100 | #256 | Tragic 91.4% |
| Cajuns | 0.7 /100 | #257 | Tragic 91.4% |
| Immigrants | Colombia | 0.6 /100 | #258 | Tragic 91.4% |
| Jamaicans | 0.6 /100 | #259 | Tragic 91.4% |
| Spanish Americans | 0.6 /100 | #260 | Tragic 91.4% |
| Taiwanese | 0.6 /100 | #261 | Tragic 91.3% |
| Immigrants | Uruguay | 0.5 /100 | #262 | Tragic 91.3% |
| Immigrants | Ghana | 0.3 /100 | #263 | Tragic 91.2% |
| Yup'ik | 0.3 /100 | #264 | Tragic 91.2% |
| Pueblo | 0.3 /100 | #265 | Tragic 91.2% |
| Immigrants | Western Africa | 0.3 /100 | #266 | Tragic 91.2% |
| Immigrants | Jamaica | 0.3 /100 | #267 | Tragic 91.2% |
| U.S. Virgin Islanders | 0.2 /100 | #268 | Tragic 91.1% |
| Ute | 0.2 /100 | #269 | Tragic 91.1% |
Demographics Similar to Immigrants from Bosnia and Herzegovina by 11th Grade
In terms of 11th grade, the demographic groups most similar to Immigrants from Bosnia and Herzegovina are Albanian (93.0%, a difference of 0.010%), Egyptian (93.0%, a difference of 0.010%), Immigrants from Ukraine (93.0%, a difference of 0.020%), Mongolian (93.0%, a difference of 0.030%), and Delaware (93.0%, a difference of 0.040%).
| Demographics | Rating | Rank | 11th Grade |
| Immigrants | Sri Lanka | 95.6 /100 | #125 | Exceptional 93.2% |
| Basques | 95.2 /100 | #126 | Exceptional 93.2% |
| Immigrants | Kazakhstan | 92.4 /100 | #127 | Exceptional 93.1% |
| Immigrants | Jordan | 92.4 /100 | #128 | Exceptional 93.1% |
| Immigrants | Ukraine | 89.8 /100 | #129 | Excellent 93.0% |
| Albanians | 89.5 /100 | #130 | Excellent 93.0% |
| Egyptians | 89.5 /100 | #131 | Excellent 93.0% |
| Immigrants | Bosnia and Herzegovina | 89.0 /100 | #132 | Excellent 93.0% |
| Mongolians | 87.6 /100 | #133 | Excellent 93.0% |
| Delaware | 87.3 /100 | #134 | Excellent 93.0% |
| Immigrants | Italy | 86.6 /100 | #135 | Excellent 92.9% |
| Cree | 85.9 /100 | #136 | Excellent 92.9% |
| Arabs | 85.4 /100 | #137 | Excellent 92.9% |
| Immigrants | Brazil | 85.1 /100 | #138 | Excellent 92.9% |
| Crow | 84.1 /100 | #139 | Excellent 92.9% |