Native/Alaskan vs Immigrants from West Indies Professional Degree
COMPARE
Native/Alaskan
Immigrants from West Indies
Professional Degree
Professional Degree Comparison
Natives/Alaskans
Immigrants from West Indies
3.0%
PROFESSIONAL DEGREE
0.0/ 100
METRIC RATING
335th/ 347
METRIC RANK
4.0%
PROFESSIONAL DEGREE
5.6/ 100
METRIC RATING
228th/ 347
METRIC RANK
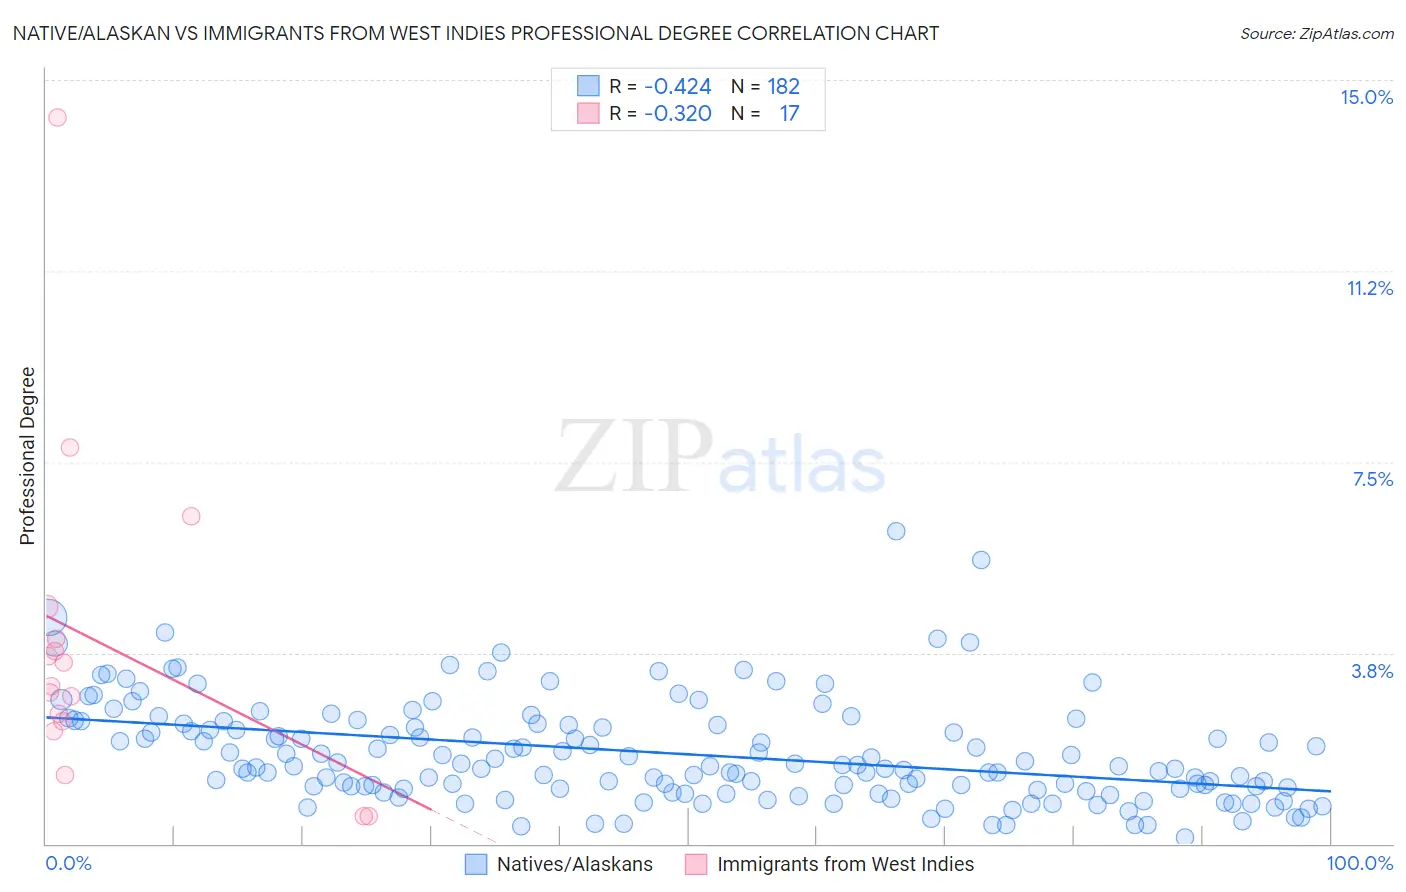
Native/Alaskan vs Immigrants from West Indies Professional Degree Correlation Chart
The statistical analysis conducted on geographies consisting of 508,142,680 people shows a moderate negative correlation between the proportion of Natives/Alaskans and percentage of population with at least professional degree education in the United States with a correlation coefficient (R) of -0.424 and weighted average of 3.0%. Similarly, the statistical analysis conducted on geographies consisting of 72,432,787 people shows a mild negative correlation between the proportion of Immigrants from West Indies and percentage of population with at least professional degree education in the United States with a correlation coefficient (R) of -0.320 and weighted average of 4.0%, a difference of 33.8%.
Professional Degree Correlation Summary
| Measurement | Native/Alaskan | Immigrants from West Indies |
| Minimum | 0.12% | 0.54% |
| Maximum | 6.1% | 14.3% |
| Range | 6.0% | 13.7% |
| Mean | 1.8% | 3.9% |
| Median | 1.5% | 3.1% |
| Interquartile 25% (IQ1) | 1.1% | 2.3% |
| Interquartile 75% (IQ3) | 2.3% | 4.3% |
| Interquartile Range (IQR) | 1.3% | 2.0% |
| Standard Deviation (Sample) | 1.0% | 3.2% |
| Standard Deviation (Population) | 1.0% | 3.1% |
Similar Demographics by Professional Degree
Demographics Similar to Natives/Alaskans by Professional Degree
In terms of professional degree, the demographic groups most similar to Natives/Alaskans are Pennsylvania German (3.0%, a difference of 0.56%), Fijian (2.9%, a difference of 1.0%), Arapaho (2.9%, a difference of 2.8%), Navajo (2.9%, a difference of 2.9%), and Immigrants from Central America (2.9%, a difference of 3.0%).
| Demographics | Rating | Rank | Professional Degree |
| Creek | 0.0 /100 | #328 | Tragic 3.1% |
| Bangladeshis | 0.0 /100 | #329 | Tragic 3.1% |
| Immigrants | Cabo Verde | 0.0 /100 | #330 | Tragic 3.1% |
| Kiowa | 0.0 /100 | #331 | Tragic 3.1% |
| Yakama | 0.0 /100 | #332 | Tragic 3.1% |
| Puget Sound Salish | 0.0 /100 | #333 | Tragic 3.1% |
| Pennsylvania Germans | 0.0 /100 | #334 | Tragic 3.0% |
| Natives/Alaskans | 0.0 /100 | #335 | Tragic 3.0% |
| Fijians | 0.0 /100 | #336 | Tragic 2.9% |
| Arapaho | 0.0 /100 | #337 | Tragic 2.9% |
| Navajo | 0.0 /100 | #338 | Tragic 2.9% |
| Immigrants | Central America | 0.0 /100 | #339 | Tragic 2.9% |
| Yup'ik | 0.0 /100 | #340 | Tragic 2.9% |
| Tohono O'odham | 0.0 /100 | #341 | Tragic 2.8% |
| Immigrants | Azores | 0.0 /100 | #342 | Tragic 2.8% |
Demographics Similar to Immigrants from West Indies by Professional Degree
In terms of professional degree, the demographic groups most similar to Immigrants from West Indies are Immigrants from Burma/Myanmar (3.9%, a difference of 0.14%), Cuban (4.0%, a difference of 0.25%), German Russian (4.0%, a difference of 0.37%), Nicaraguan (3.9%, a difference of 0.42%), and Ecuadorian (3.9%, a difference of 0.87%).
| Demographics | Rating | Rank | Professional Degree |
| French Canadians | 8.0 /100 | #221 | Tragic 4.0% |
| Immigrants | Western Africa | 7.5 /100 | #222 | Tragic 4.0% |
| Immigrants | Bosnia and Herzegovina | 7.4 /100 | #223 | Tragic 4.0% |
| Trinidadians and Tobagonians | 7.1 /100 | #224 | Tragic 4.0% |
| Tlingit-Haida | 6.9 /100 | #225 | Tragic 4.0% |
| German Russians | 6.1 /100 | #226 | Tragic 4.0% |
| Cubans | 5.9 /100 | #227 | Tragic 4.0% |
| Immigrants | West Indies | 5.6 /100 | #228 | Tragic 4.0% |
| Immigrants | Burma/Myanmar | 5.4 /100 | #229 | Tragic 3.9% |
| Nicaraguans | 5.1 /100 | #230 | Tragic 3.9% |
| Ecuadorians | 4.6 /100 | #231 | Tragic 3.9% |
| Cree | 4.3 /100 | #232 | Tragic 3.9% |
| Immigrants | Philippines | 4.1 /100 | #233 | Tragic 3.9% |
| Immigrants | Nonimmigrants | 4.0 /100 | #234 | Tragic 3.9% |
| Immigrants | Barbados | 4.0 /100 | #235 | Tragic 3.9% |