Immigrants from Southern Europe vs Seminole Doctorate Degree
COMPARE
Immigrants from Southern Europe
Seminole
Doctorate Degree
Doctorate Degree Comparison
Immigrants from Southern Europe
Seminole
2.0%
DOCTORATE DEGREE
94.7/ 100
METRIC RATING
122nd/ 347
METRIC RANK
1.3%
DOCTORATE DEGREE
0.1/ 100
METRIC RATING
322nd/ 347
METRIC RANK
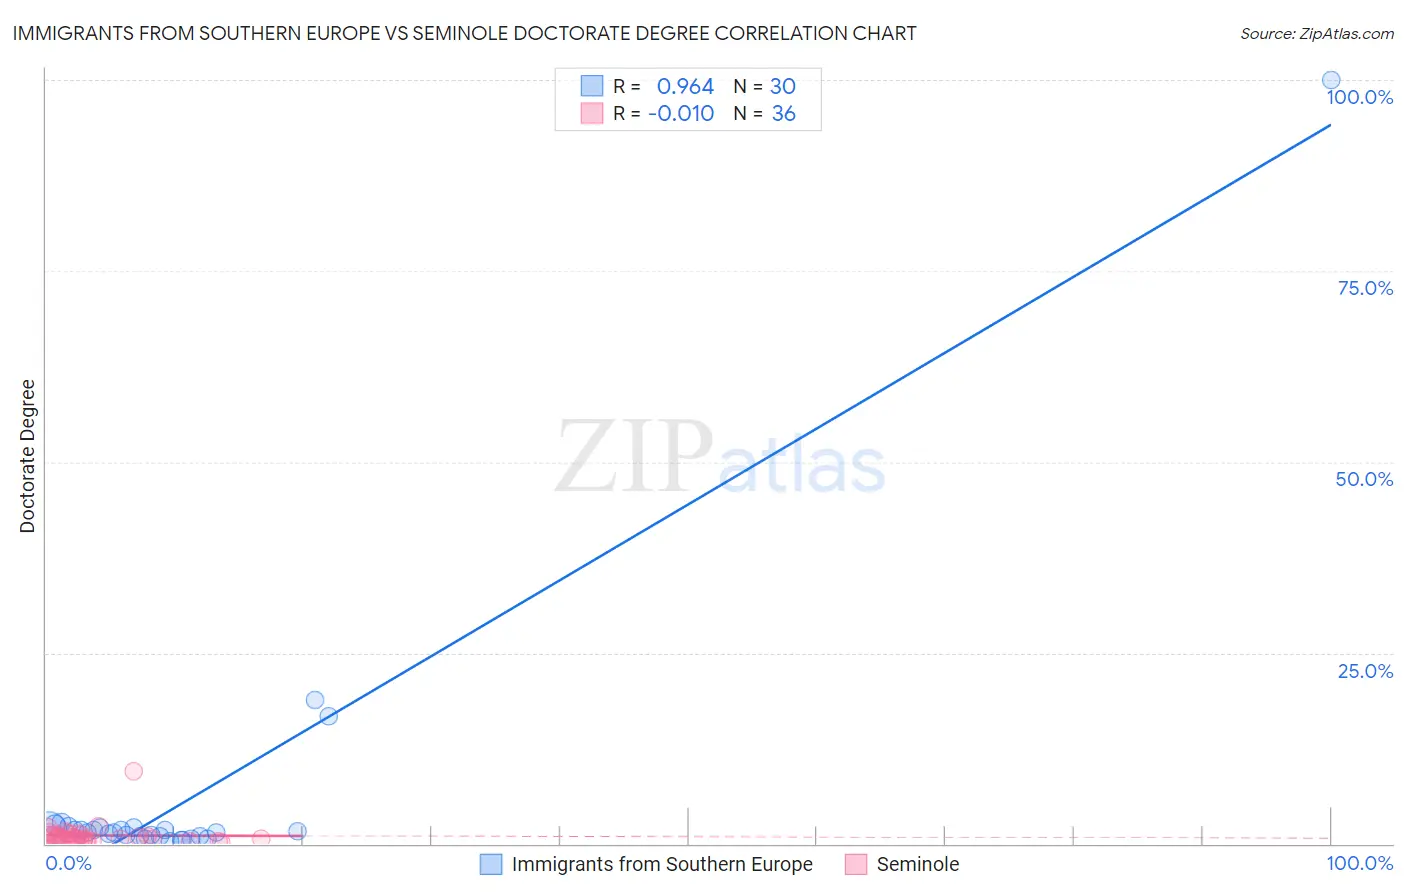
Immigrants from Southern Europe vs Seminole Doctorate Degree Correlation Chart
The statistical analysis conducted on geographies consisting of 399,415,289 people shows a perfect positive correlation between the proportion of Immigrants from Southern Europe and percentage of population with at least doctorate degree education in the United States with a correlation coefficient (R) of 0.964 and weighted average of 2.0%. Similarly, the statistical analysis conducted on geographies consisting of 117,553,493 people shows no correlation between the proportion of Seminole and percentage of population with at least doctorate degree education in the United States with a correlation coefficient (R) of -0.010 and weighted average of 1.3%, a difference of 52.8%.
Doctorate Degree Correlation Summary
| Measurement | Immigrants from Southern Europe | Seminole |
| Minimum | 0.40% | 0.13% |
| Maximum | 100.0% | 9.6% |
| Range | 99.6% | 9.4% |
| Mean | 5.8% | 1.1% |
| Median | 1.5% | 0.72% |
| Interquartile 25% (IQ1) | 1.0% | 0.51% |
| Interquartile 75% (IQ3) | 2.1% | 1.2% |
| Interquartile Range (IQR) | 1.1% | 0.69% |
| Standard Deviation (Sample) | 18.3% | 1.5% |
| Standard Deviation (Population) | 18.0% | 1.5% |
Similar Demographics by Doctorate Degree
Demographics Similar to Immigrants from Southern Europe by Doctorate Degree
In terms of doctorate degree, the demographic groups most similar to Immigrants from Southern Europe are Immigrants from Jordan (2.0%, a difference of 0.030%), Croatian (2.0%, a difference of 0.46%), Immigrants from Morocco (2.0%, a difference of 0.50%), Pakistani (2.0%, a difference of 0.79%), and Icelander (2.1%, a difference of 0.92%).
| Demographics | Rating | Rank | Doctorate Degree |
| Taiwanese | 96.7 /100 | #115 | Exceptional 2.1% |
| Maltese | 96.2 /100 | #116 | Exceptional 2.1% |
| Lebanese | 96.0 /100 | #117 | Exceptional 2.1% |
| Icelanders | 96.0 /100 | #118 | Exceptional 2.1% |
| Pakistanis | 95.8 /100 | #119 | Exceptional 2.0% |
| Immigrants | Morocco | 95.5 /100 | #120 | Exceptional 2.0% |
| Immigrants | Jordan | 94.8 /100 | #121 | Exceptional 2.0% |
| Immigrants | Southern Europe | 94.7 /100 | #122 | Exceptional 2.0% |
| Croatians | 94.0 /100 | #123 | Exceptional 2.0% |
| Ute | 93.2 /100 | #124 | Exceptional 2.0% |
| Moroccans | 93.0 /100 | #125 | Exceptional 2.0% |
| Jordanians | 92.1 /100 | #126 | Exceptional 2.0% |
| Palestinians | 92.0 /100 | #127 | Exceptional 2.0% |
| Immigrants | Zaire | 91.1 /100 | #128 | Exceptional 2.0% |
| Canadians | 90.6 /100 | #129 | Exceptional 2.0% |
Demographics Similar to Seminole by Doctorate Degree
In terms of doctorate degree, the demographic groups most similar to Seminole are Dutch West Indian (1.3%, a difference of 0.060%), Immigrants from St. Vincent and the Grenadines (1.3%, a difference of 0.16%), Immigrants from Belize (1.3%, a difference of 0.20%), Immigrants from Guyana (1.3%, a difference of 0.23%), and Native/Alaskan (1.3%, a difference of 0.52%).
| Demographics | Rating | Rank | Doctorate Degree |
| Immigrants | Azores | 0.1 /100 | #315 | Tragic 1.4% |
| Navajo | 0.1 /100 | #316 | Tragic 1.4% |
| Immigrants | Micronesia | 0.1 /100 | #317 | Tragic 1.3% |
| Creek | 0.1 /100 | #318 | Tragic 1.3% |
| Immigrants | Guyana | 0.1 /100 | #319 | Tragic 1.3% |
| Immigrants | St. Vincent and the Grenadines | 0.1 /100 | #320 | Tragic 1.3% |
| Dutch West Indians | 0.1 /100 | #321 | Tragic 1.3% |
| Seminole | 0.1 /100 | #322 | Tragic 1.3% |
| Immigrants | Belize | 0.1 /100 | #323 | Tragic 1.3% |
| Natives/Alaskans | 0.0 /100 | #324 | Tragic 1.3% |
| Pima | 0.0 /100 | #325 | Tragic 1.3% |
| Immigrants | Cabo Verde | 0.0 /100 | #326 | Tragic 1.3% |
| Hispanics or Latinos | 0.0 /100 | #327 | Tragic 1.3% |
| Inupiat | 0.0 /100 | #328 | Tragic 1.3% |
| Haitians | 0.0 /100 | #329 | Tragic 1.3% |