Costa Rican vs Choctaw Professional Degree
COMPARE
Costa Rican
Choctaw
Professional Degree
Professional Degree Comparison
Costa Ricans
Choctaw
4.5%
PROFESSIONAL DEGREE
59.9/ 100
METRIC RATING
165th/ 347
METRIC RANK
3.2%
PROFESSIONAL DEGREE
0.1/ 100
METRIC RATING
319th/ 347
METRIC RANK
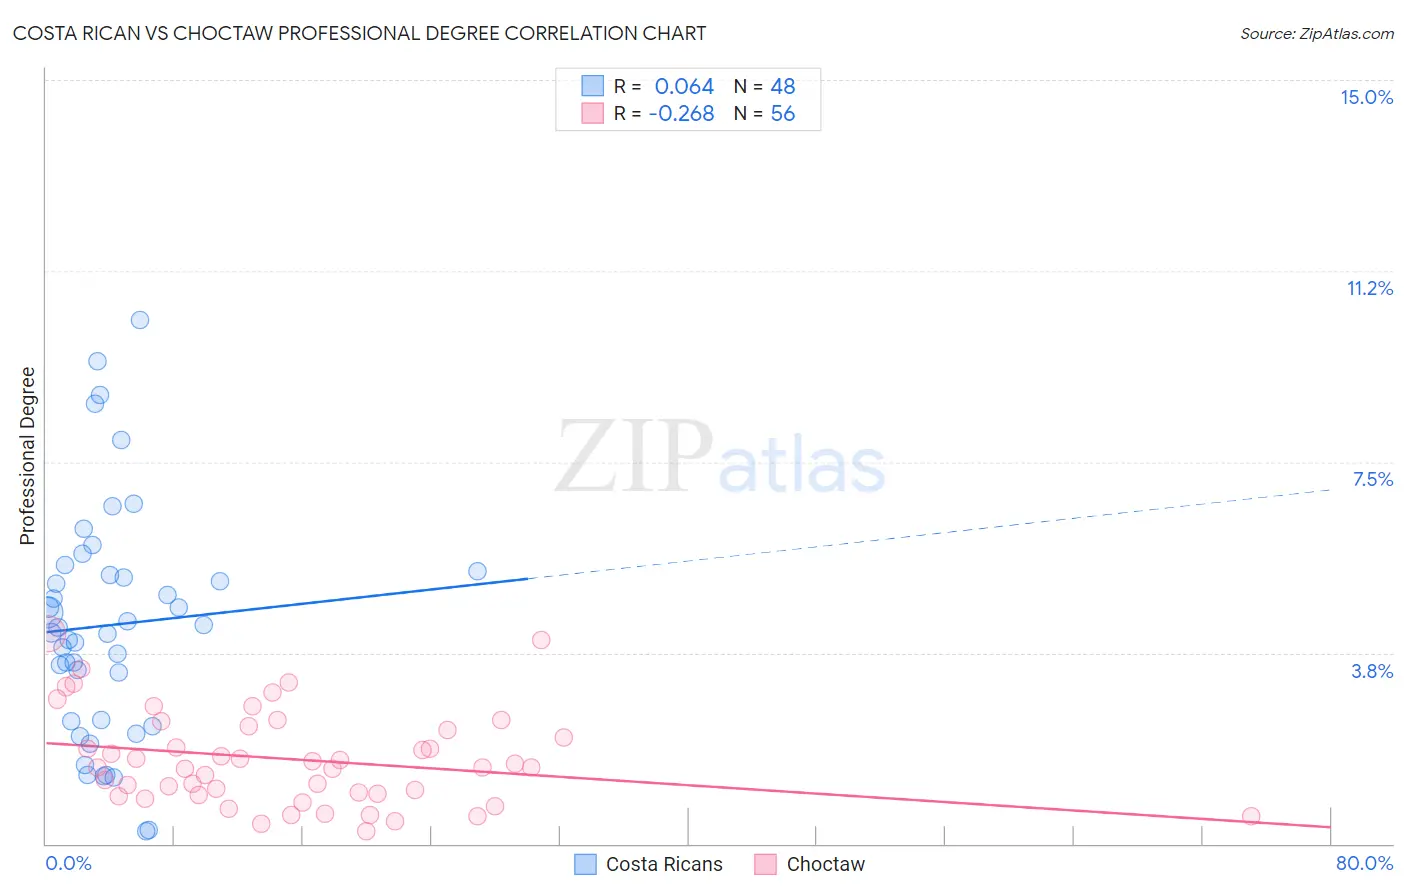
Costa Rican vs Choctaw Professional Degree Correlation Chart
The statistical analysis conducted on geographies consisting of 253,366,674 people shows a slight positive correlation between the proportion of Costa Ricans and percentage of population with at least professional degree education in the United States with a correlation coefficient (R) of 0.064 and weighted average of 4.5%. Similarly, the statistical analysis conducted on geographies consisting of 268,673,582 people shows a weak negative correlation between the proportion of Choctaw and percentage of population with at least professional degree education in the United States with a correlation coefficient (R) of -0.268 and weighted average of 3.2%, a difference of 38.5%.
Professional Degree Correlation Summary
| Measurement | Costa Rican | Choctaw |
| Minimum | 0.25% | 0.25% |
| Maximum | 10.3% | 4.1% |
| Range | 10.0% | 3.9% |
| Mean | 4.3% | 1.7% |
| Median | 4.2% | 1.5% |
| Interquartile 25% (IQ1) | 2.4% | 0.97% |
| Interquartile 75% (IQ3) | 5.3% | 2.3% |
| Interquartile Range (IQR) | 2.9% | 1.3% |
| Standard Deviation (Sample) | 2.3% | 0.93% |
| Standard Deviation (Population) | 2.3% | 0.92% |
Similar Demographics by Professional Degree
Demographics Similar to Costa Ricans by Professional Degree
In terms of professional degree, the demographic groups most similar to Costa Ricans are Immigrants from Colombia (4.5%, a difference of 0.080%), Immigrants from Afghanistan (4.5%, a difference of 0.11%), Swiss (4.5%, a difference of 0.17%), Immigrants from Sierra Leone (4.5%, a difference of 0.17%), and Chinese (4.5%, a difference of 0.19%).
| Demographics | Rating | Rank | Professional Degree |
| Immigrants | Armenia | 68.8 /100 | #158 | Good 4.5% |
| Vietnamese | 68.4 /100 | #159 | Good 4.5% |
| Immigrants | Senegal | 68.0 /100 | #160 | Good 4.5% |
| Assyrians/Chaldeans/Syriacs | 67.4 /100 | #161 | Good 4.5% |
| Peruvians | 65.2 /100 | #162 | Good 4.5% |
| Sierra Leoneans | 64.3 /100 | #163 | Good 4.5% |
| Swiss | 61.0 /100 | #164 | Good 4.5% |
| Costa Ricans | 59.9 /100 | #165 | Average 4.5% |
| Immigrants | Colombia | 59.4 /100 | #166 | Average 4.5% |
| Immigrants | Afghanistan | 59.2 /100 | #167 | Average 4.5% |
| Immigrants | Sierra Leone | 58.7 /100 | #168 | Average 4.5% |
| Chinese | 58.6 /100 | #169 | Average 4.5% |
| Immigrants | Zaire | 57.4 /100 | #170 | Average 4.5% |
| Immigrants | Bangladesh | 56.0 /100 | #171 | Average 4.4% |
| Spaniards | 52.0 /100 | #172 | Average 4.4% |
Demographics Similar to Choctaw by Professional Degree
In terms of professional degree, the demographic groups most similar to Choctaw are Immigrants from Micronesia (3.2%, a difference of 0.24%), Nepalese (3.2%, a difference of 0.27%), Puerto Rican (3.2%, a difference of 0.48%), Immigrants from Laos (3.2%, a difference of 0.50%), and Seminole (3.2%, a difference of 1.1%).
| Demographics | Rating | Rank | Professional Degree |
| Sioux | 0.1 /100 | #312 | Tragic 3.3% |
| Yuman | 0.1 /100 | #313 | Tragic 3.3% |
| Mexican American Indians | 0.1 /100 | #314 | Tragic 3.3% |
| Immigrants | Laos | 0.1 /100 | #315 | Tragic 3.2% |
| Puerto Ricans | 0.1 /100 | #316 | Tragic 3.2% |
| Nepalese | 0.1 /100 | #317 | Tragic 3.2% |
| Immigrants | Micronesia | 0.1 /100 | #318 | Tragic 3.2% |
| Choctaw | 0.1 /100 | #319 | Tragic 3.2% |
| Seminole | 0.1 /100 | #320 | Tragic 3.2% |
| Tsimshian | 0.0 /100 | #321 | Tragic 3.2% |
| Hispanics or Latinos | 0.0 /100 | #322 | Tragic 3.2% |
| Inupiat | 0.0 /100 | #323 | Tragic 3.2% |
| Crow | 0.0 /100 | #324 | Tragic 3.2% |
| Yaqui | 0.0 /100 | #325 | Tragic 3.2% |
| Menominee | 0.0 /100 | #326 | Tragic 3.1% |