Moroccan vs Alsatian 5th Grade
COMPARE
Moroccan
Alsatian
5th Grade
5th Grade Comparison
Moroccans
Alsatians
97.1%
5TH GRADE
12.0/ 100
METRIC RATING
205th/ 347
METRIC RANK
97.4%
5TH GRADE
74.3/ 100
METRIC RATING
153rd/ 347
METRIC RANK
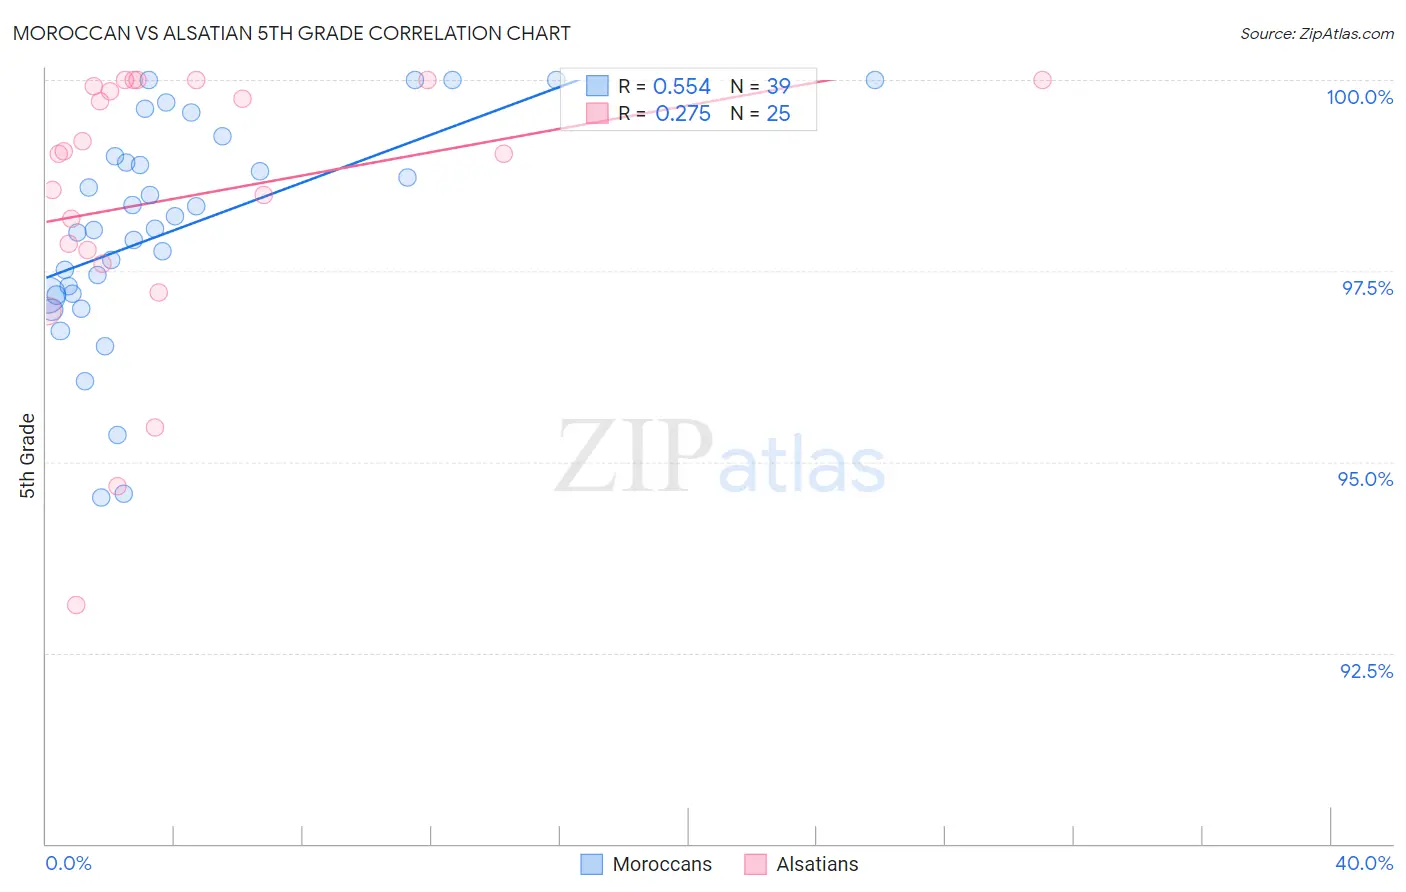
Moroccan vs Alsatian 5th Grade Correlation Chart
The statistical analysis conducted on geographies consisting of 201,817,667 people shows a substantial positive correlation between the proportion of Moroccans and percentage of population with at least 5th grade education in the United States with a correlation coefficient (R) of 0.554 and weighted average of 97.1%. Similarly, the statistical analysis conducted on geographies consisting of 82,682,365 people shows a weak positive correlation between the proportion of Alsatians and percentage of population with at least 5th grade education in the United States with a correlation coefficient (R) of 0.275 and weighted average of 97.4%, a difference of 0.32%.
5th Grade Correlation Summary
| Measurement | Moroccan | Alsatian |
| Minimum | 94.5% | 93.1% |
| Maximum | 100.0% | 100.0% |
| Range | 5.5% | 6.9% |
| Mean | 98.0% | 98.5% |
| Median | 98.1% | 99.0% |
| Interquartile 25% (IQ1) | 97.2% | 97.7% |
| Interquartile 75% (IQ3) | 99.0% | 100.0% |
| Interquartile Range (IQR) | 1.8% | 2.3% |
| Standard Deviation (Sample) | 1.4% | 1.8% |
| Standard Deviation (Population) | 1.4% | 1.8% |
Similar Demographics by 5th Grade
Demographics Similar to Moroccans by 5th Grade
In terms of 5th grade, the demographic groups most similar to Moroccans are Paiute (97.1%, a difference of 0.0%), Iraqi (97.1%, a difference of 0.010%), Laotian (97.1%, a difference of 0.010%), Immigrants from Zaire (97.1%, a difference of 0.020%), and Immigrants from Nepal (97.1%, a difference of 0.020%).
| Demographics | Rating | Rank | 5th Grade |
| Immigrants | Uganda | 21.1 /100 | #198 | Fair 97.2% |
| Natives/Alaskans | 18.0 /100 | #199 | Poor 97.2% |
| Immigrants | Northern Africa | 16.8 /100 | #200 | Poor 97.2% |
| Immigrants | Chile | 16.6 /100 | #201 | Poor 97.2% |
| Africans | 15.3 /100 | #202 | Poor 97.2% |
| Immigrants | Bahamas | 14.9 /100 | #203 | Poor 97.2% |
| Immigrants | Zaire | 13.7 /100 | #204 | Poor 97.1% |
| Moroccans | 12.0 /100 | #205 | Poor 97.1% |
| Paiute | 11.6 /100 | #206 | Poor 97.1% |
| Iraqis | 10.9 /100 | #207 | Poor 97.1% |
| Laotians | 10.8 /100 | #208 | Poor 97.1% |
| Immigrants | Nepal | 10.3 /100 | #209 | Poor 97.1% |
| Immigrants | Oceania | 10.0 /100 | #210 | Poor 97.1% |
| Samoans | 8.5 /100 | #211 | Tragic 97.1% |
| Immigrants | Iraq | 8.3 /100 | #212 | Tragic 97.1% |
Demographics Similar to Alsatians by 5th Grade
In terms of 5th grade, the demographic groups most similar to Alsatians are Immigrants from Eastern Europe (97.4%, a difference of 0.0%), Ute (97.4%, a difference of 0.0%), Immigrants from South Central Asia (97.5%, a difference of 0.020%), Immigrants from Russia (97.4%, a difference of 0.020%), and Immigrants from Bosnia and Herzegovina (97.4%, a difference of 0.020%).
| Demographics | Rating | Rank | 5th Grade |
| Spaniards | 81.9 /100 | #146 | Excellent 97.5% |
| Soviet Union | 81.2 /100 | #147 | Excellent 97.5% |
| Immigrants | Israel | 79.1 /100 | #148 | Good 97.5% |
| Hopi | 78.6 /100 | #149 | Good 97.5% |
| Immigrants | South Central Asia | 78.6 /100 | #150 | Good 97.5% |
| Immigrants | Eastern Europe | 75.0 /100 | #151 | Good 97.4% |
| Ute | 74.9 /100 | #152 | Good 97.4% |
| Alsatians | 74.3 /100 | #153 | Good 97.4% |
| Immigrants | Russia | 71.2 /100 | #154 | Good 97.4% |
| Immigrants | Bosnia and Herzegovina | 71.0 /100 | #155 | Good 97.4% |
| French American Indians | 70.5 /100 | #156 | Good 97.4% |
| Immigrants | Jordan | 70.4 /100 | #157 | Good 97.4% |
| Albanians | 68.3 /100 | #158 | Good 97.4% |
| Immigrants | Italy | 65.2 /100 | #159 | Good 97.4% |
| Marshallese | 61.2 /100 | #160 | Good 97.4% |