Moroccan vs Iranian 5th Grade
COMPARE
Moroccan
Iranian
5th Grade
5th Grade Comparison
Moroccans
Iranians
97.1%
5TH GRADE
12.0/ 100
METRIC RATING
205th/ 347
METRIC RANK
97.9%
5TH GRADE
99.5/ 100
METRIC RATING
70th/ 347
METRIC RANK
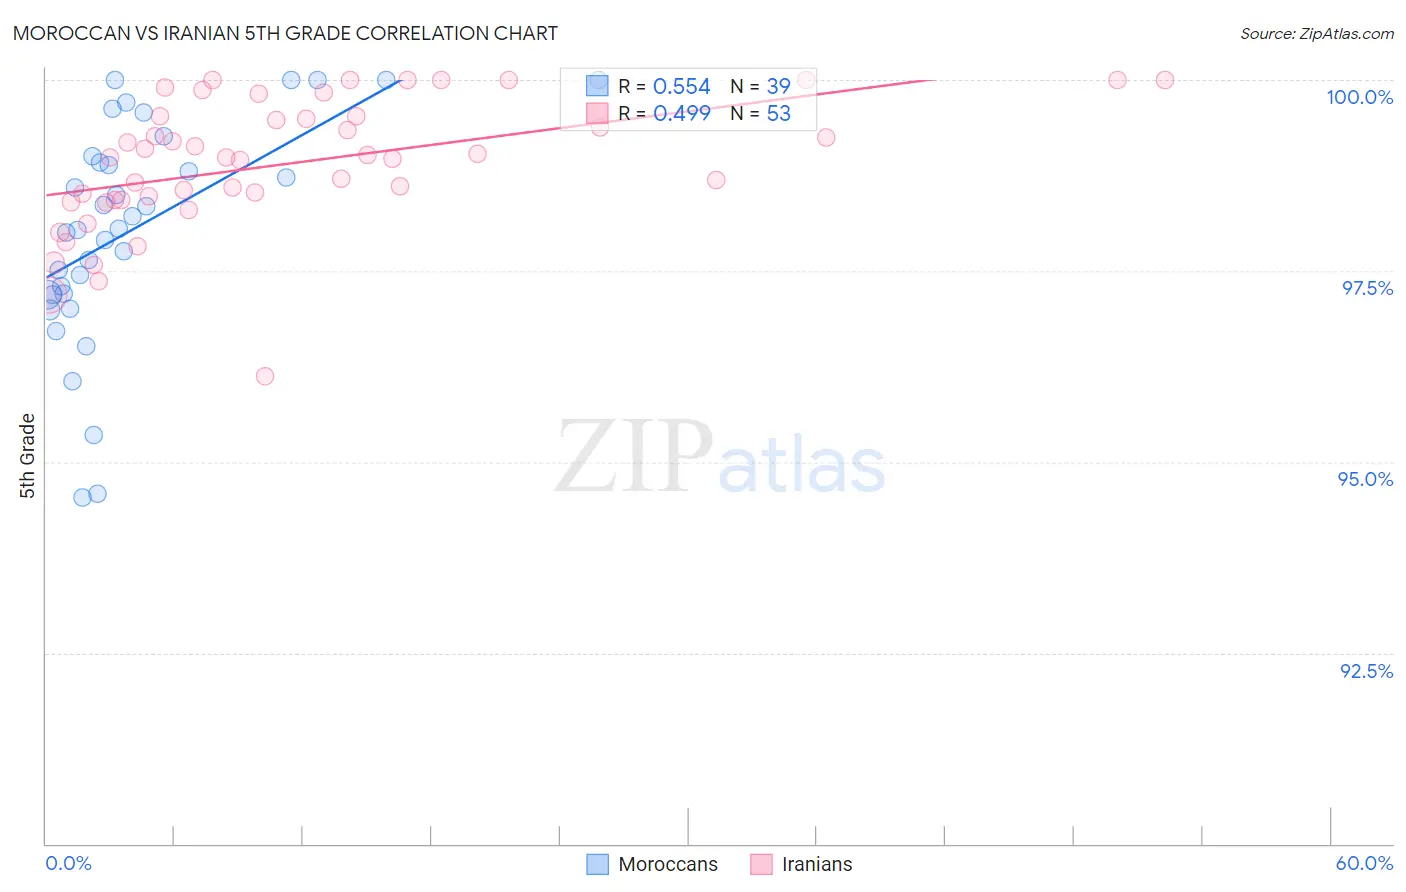
Moroccan vs Iranian 5th Grade Correlation Chart
The statistical analysis conducted on geographies consisting of 201,817,667 people shows a substantial positive correlation between the proportion of Moroccans and percentage of population with at least 5th grade education in the United States with a correlation coefficient (R) of 0.554 and weighted average of 97.1%. Similarly, the statistical analysis conducted on geographies consisting of 310,636,461 people shows a moderate positive correlation between the proportion of Iranians and percentage of population with at least 5th grade education in the United States with a correlation coefficient (R) of 0.499 and weighted average of 97.9%, a difference of 0.75%.
5th Grade Correlation Summary
| Measurement | Moroccan | Iranian |
| Minimum | 94.5% | 96.1% |
| Maximum | 100.0% | 100.0% |
| Range | 5.5% | 3.9% |
| Mean | 98.0% | 98.9% |
| Median | 98.1% | 99.0% |
| Interquartile 25% (IQ1) | 97.2% | 98.4% |
| Interquartile 75% (IQ3) | 99.0% | 99.5% |
| Interquartile Range (IQR) | 1.8% | 1.1% |
| Standard Deviation (Sample) | 1.4% | 0.86% |
| Standard Deviation (Population) | 1.4% | 0.85% |
Similar Demographics by 5th Grade
Demographics Similar to Moroccans by 5th Grade
In terms of 5th grade, the demographic groups most similar to Moroccans are Paiute (97.1%, a difference of 0.0%), Iraqi (97.1%, a difference of 0.010%), Laotian (97.1%, a difference of 0.010%), Immigrants from Zaire (97.1%, a difference of 0.020%), and Immigrants from Nepal (97.1%, a difference of 0.020%).
| Demographics | Rating | Rank | 5th Grade |
| Immigrants | Uganda | 21.1 /100 | #198 | Fair 97.2% |
| Natives/Alaskans | 18.0 /100 | #199 | Poor 97.2% |
| Immigrants | Northern Africa | 16.8 /100 | #200 | Poor 97.2% |
| Immigrants | Chile | 16.6 /100 | #201 | Poor 97.2% |
| Africans | 15.3 /100 | #202 | Poor 97.2% |
| Immigrants | Bahamas | 14.9 /100 | #203 | Poor 97.2% |
| Immigrants | Zaire | 13.7 /100 | #204 | Poor 97.1% |
| Moroccans | 12.0 /100 | #205 | Poor 97.1% |
| Paiute | 11.6 /100 | #206 | Poor 97.1% |
| Iraqis | 10.9 /100 | #207 | Poor 97.1% |
| Laotians | 10.8 /100 | #208 | Poor 97.1% |
| Immigrants | Nepal | 10.3 /100 | #209 | Poor 97.1% |
| Immigrants | Oceania | 10.0 /100 | #210 | Poor 97.1% |
| Samoans | 8.5 /100 | #211 | Tragic 97.1% |
| Immigrants | Iraq | 8.3 /100 | #212 | Tragic 97.1% |
Demographics Similar to Iranians by 5th Grade
In terms of 5th grade, the demographic groups most similar to Iranians are Chickasaw (97.9%, a difference of 0.0%), Kiowa (97.9%, a difference of 0.010%), Macedonian (97.9%, a difference of 0.010%), Cajun (97.9%, a difference of 0.020%), and Cherokee (97.8%, a difference of 0.020%).
| Demographics | Rating | Rank | 5th Grade |
| Russians | 99.7 /100 | #63 | Exceptional 97.9% |
| Immigrants | Northern Europe | 99.6 /100 | #64 | Exceptional 97.9% |
| Canadians | 99.6 /100 | #65 | Exceptional 97.9% |
| Immigrants | Austria | 99.6 /100 | #66 | Exceptional 97.9% |
| New Zealanders | 99.6 /100 | #67 | Exceptional 97.9% |
| Cajuns | 99.6 /100 | #68 | Exceptional 97.9% |
| Kiowa | 99.5 /100 | #69 | Exceptional 97.9% |
| Iranians | 99.5 /100 | #70 | Exceptional 97.9% |
| Chickasaw | 99.5 /100 | #71 | Exceptional 97.9% |
| Macedonians | 99.4 /100 | #72 | Exceptional 97.9% |
| Cherokee | 99.4 /100 | #73 | Exceptional 97.8% |
| Lumbee | 99.3 /100 | #74 | Exceptional 97.8% |
| Ukrainians | 99.3 /100 | #75 | Exceptional 97.8% |
| Immigrants | Netherlands | 99.3 /100 | #76 | Exceptional 97.8% |
| Immigrants | England | 99.3 /100 | #77 | Exceptional 97.8% |