Indonesian vs Alsatian 5th Grade
COMPARE
Indonesian
Alsatian
5th Grade
5th Grade Comparison
Indonesians
Alsatians
96.0%
5TH GRADE
0.0/ 100
METRIC RATING
310th/ 347
METRIC RANK
97.4%
5TH GRADE
74.3/ 100
METRIC RATING
153rd/ 347
METRIC RANK
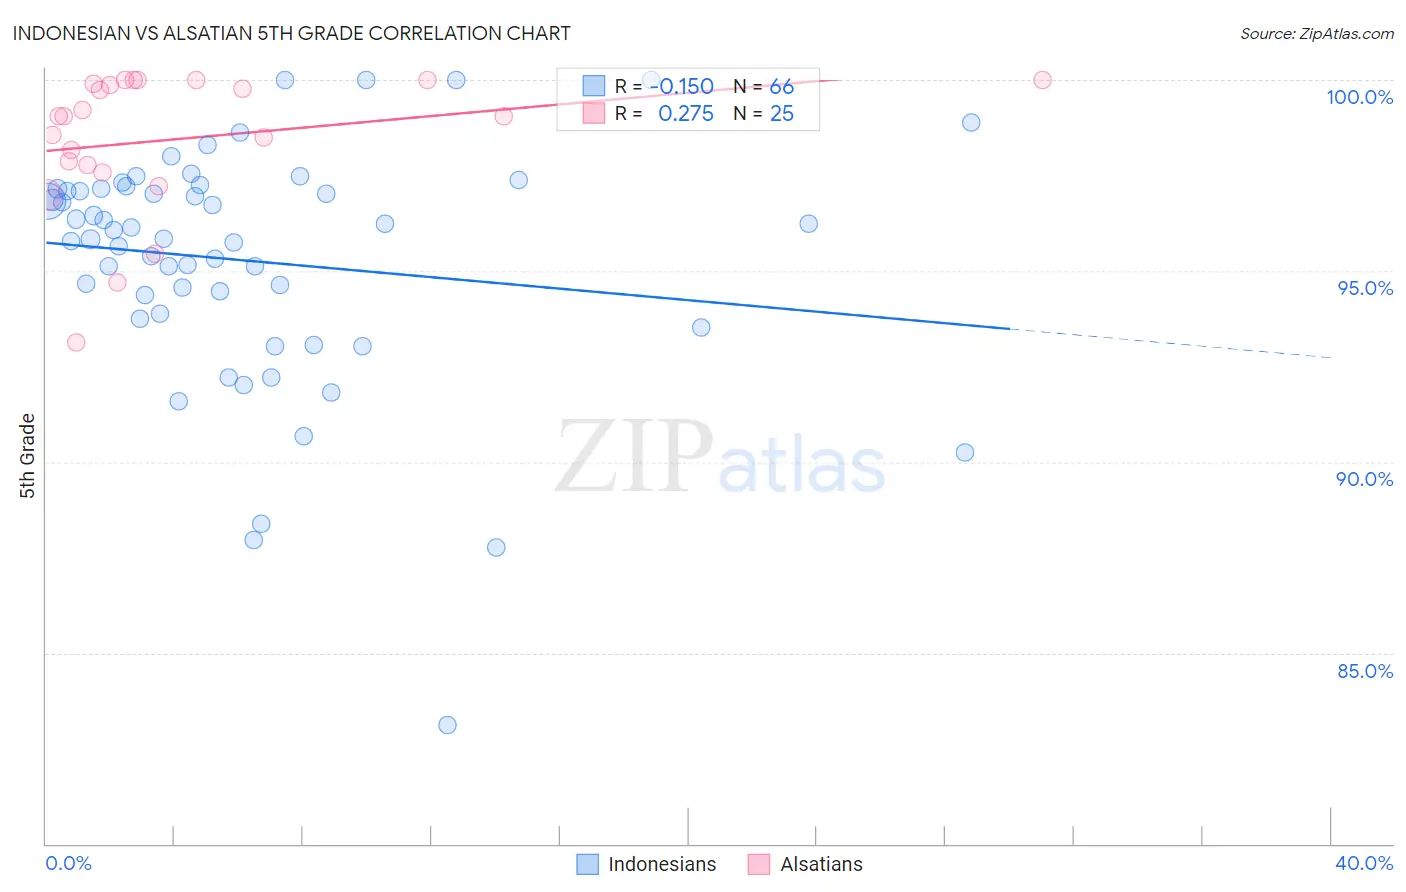
Indonesian vs Alsatian 5th Grade Correlation Chart
The statistical analysis conducted on geographies consisting of 162,727,113 people shows a poor negative correlation between the proportion of Indonesians and percentage of population with at least 5th grade education in the United States with a correlation coefficient (R) of -0.150 and weighted average of 96.0%. Similarly, the statistical analysis conducted on geographies consisting of 82,682,365 people shows a weak positive correlation between the proportion of Alsatians and percentage of population with at least 5th grade education in the United States with a correlation coefficient (R) of 0.275 and weighted average of 97.4%, a difference of 1.5%.
5th Grade Correlation Summary
| Measurement | Indonesian | Alsatian |
| Minimum | 83.1% | 93.1% |
| Maximum | 100.0% | 100.0% |
| Range | 16.9% | 6.9% |
| Mean | 95.3% | 98.5% |
| Median | 96.0% | 99.0% |
| Interquartile 25% (IQ1) | 93.9% | 97.7% |
| Interquartile 75% (IQ3) | 97.1% | 100.0% |
| Interquartile Range (IQR) | 3.3% | 2.3% |
| Standard Deviation (Sample) | 3.1% | 1.8% |
| Standard Deviation (Population) | 3.1% | 1.8% |
Similar Demographics by 5th Grade
Demographics Similar to Indonesians by 5th Grade
In terms of 5th grade, the demographic groups most similar to Indonesians are Immigrants from Bangladesh (96.0%, a difference of 0.020%), Immigrants from Guyana (96.0%, a difference of 0.040%), Ecuadorian (96.0%, a difference of 0.050%), Vietnamese (95.9%, a difference of 0.050%), and Immigrants from Haiti (96.0%, a difference of 0.060%).
| Demographics | Rating | Rank | 5th Grade |
| Puerto Ricans | 0.0 /100 | #303 | Tragic 96.1% |
| Immigrants | Burma/Myanmar | 0.0 /100 | #304 | Tragic 96.1% |
| Immigrants | Laos | 0.0 /100 | #305 | Tragic 96.0% |
| Immigrants | Haiti | 0.0 /100 | #306 | Tragic 96.0% |
| Immigrants | Caribbean | 0.0 /100 | #307 | Tragic 96.0% |
| Ecuadorians | 0.0 /100 | #308 | Tragic 96.0% |
| Immigrants | Guyana | 0.0 /100 | #309 | Tragic 96.0% |
| Indonesians | 0.0 /100 | #310 | Tragic 96.0% |
| Immigrants | Bangladesh | 0.0 /100 | #311 | Tragic 96.0% |
| Vietnamese | 0.0 /100 | #312 | Tragic 95.9% |
| Bangladeshis | 0.0 /100 | #313 | Tragic 95.9% |
| Immigrants | Portugal | 0.0 /100 | #314 | Tragic 95.9% |
| Nicaraguans | 0.0 /100 | #315 | Tragic 95.9% |
| Immigrants | Ecuador | 0.0 /100 | #316 | Tragic 95.8% |
| Belizeans | 0.0 /100 | #317 | Tragic 95.8% |
Demographics Similar to Alsatians by 5th Grade
In terms of 5th grade, the demographic groups most similar to Alsatians are Immigrants from Eastern Europe (97.4%, a difference of 0.0%), Ute (97.4%, a difference of 0.0%), Immigrants from South Central Asia (97.5%, a difference of 0.020%), Immigrants from Russia (97.4%, a difference of 0.020%), and Immigrants from Bosnia and Herzegovina (97.4%, a difference of 0.020%).
| Demographics | Rating | Rank | 5th Grade |
| Spaniards | 81.9 /100 | #146 | Excellent 97.5% |
| Soviet Union | 81.2 /100 | #147 | Excellent 97.5% |
| Immigrants | Israel | 79.1 /100 | #148 | Good 97.5% |
| Hopi | 78.6 /100 | #149 | Good 97.5% |
| Immigrants | South Central Asia | 78.6 /100 | #150 | Good 97.5% |
| Immigrants | Eastern Europe | 75.0 /100 | #151 | Good 97.4% |
| Ute | 74.9 /100 | #152 | Good 97.4% |
| Alsatians | 74.3 /100 | #153 | Good 97.4% |
| Immigrants | Russia | 71.2 /100 | #154 | Good 97.4% |
| Immigrants | Bosnia and Herzegovina | 71.0 /100 | #155 | Good 97.4% |
| French American Indians | 70.5 /100 | #156 | Good 97.4% |
| Immigrants | Jordan | 70.4 /100 | #157 | Good 97.4% |
| Albanians | 68.3 /100 | #158 | Good 97.4% |
| Immigrants | Italy | 65.2 /100 | #159 | Good 97.4% |
| Marshallese | 61.2 /100 | #160 | Good 97.4% |