Moroccan vs Alsatian Unemployment Among Seniors over 75 years
COMPARE
Moroccan
Alsatian
Unemployment Among Seniors over 75 years
Unemployment Among Seniors over 75 years Comparison
Moroccans
Alsatians
7.8%
UNEMPLOYMENT AMONG SENIORS OVER 75 YEARS
100.0/ 100
METRIC RATING
51st/ 347
METRIC RANK
6.1%
UNEMPLOYMENT AMONG SENIORS OVER 75 YEARS
100.0/ 100
METRIC RATING
4th/ 347
METRIC RANK
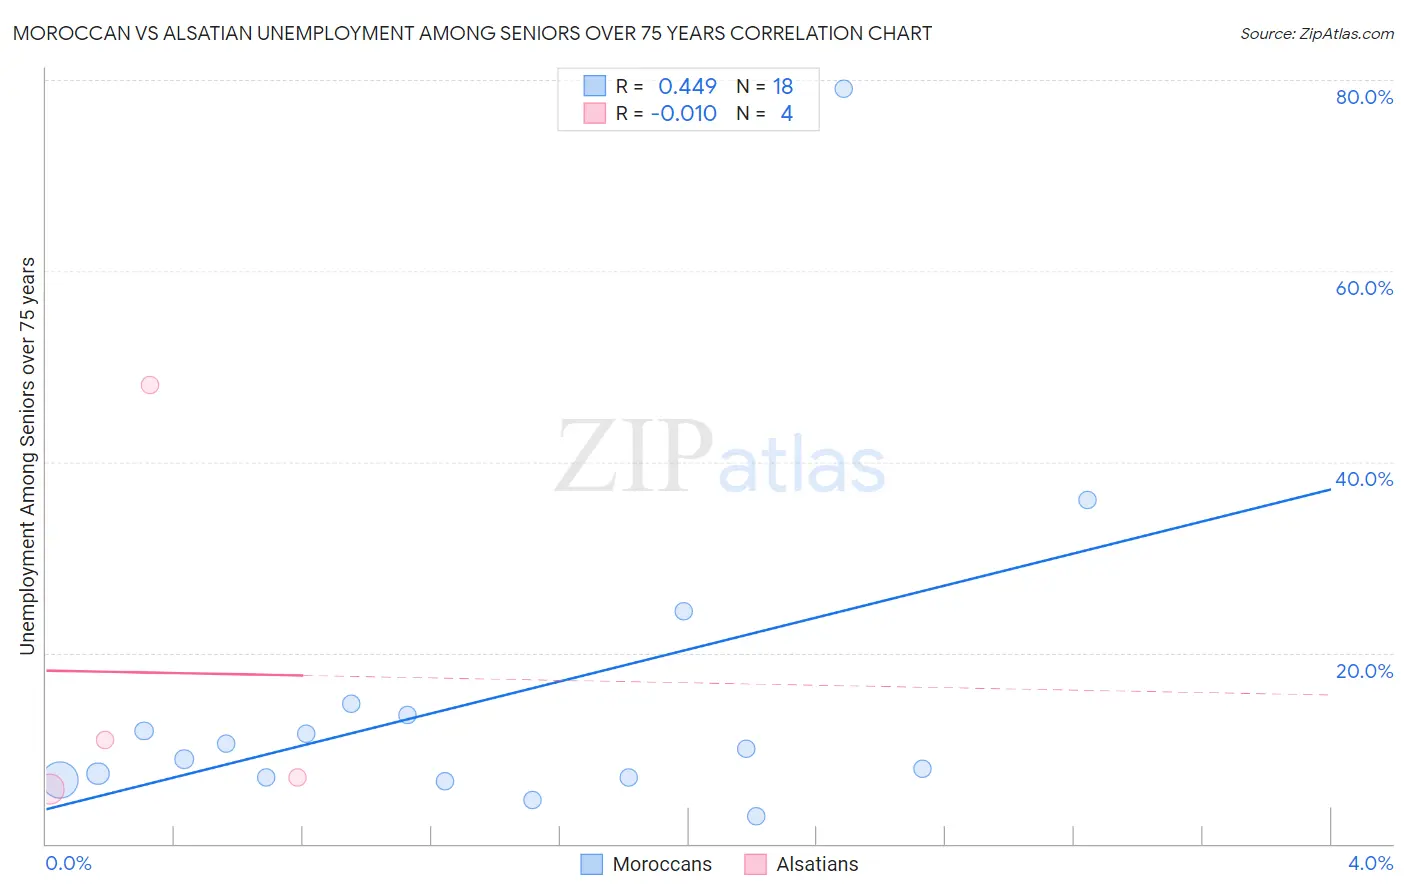
Moroccan vs Alsatian Unemployment Among Seniors over 75 years Correlation Chart
The statistical analysis conducted on geographies consisting of 131,616,504 people shows a moderate positive correlation between the proportion of Moroccans and unemployment rate among seniors over the age of 75 in the United States with a correlation coefficient (R) of 0.449 and weighted average of 7.8%. Similarly, the statistical analysis conducted on geographies consisting of 64,928,583 people shows no correlation between the proportion of Alsatians and unemployment rate among seniors over the age of 75 in the United States with a correlation coefficient (R) of -0.010 and weighted average of 6.1%, a difference of 28.0%.
Unemployment Among Seniors over 75 years Correlation Summary
| Measurement | Moroccan | Alsatian |
| Minimum | 2.9% | 5.7% |
| Maximum | 79.1% | 48.1% |
| Range | 76.2% | 42.4% |
| Mean | 15.0% | 17.9% |
| Median | 9.4% | 8.9% |
| Interquartile 25% (IQ1) | 6.9% | 6.4% |
| Interquartile 75% (IQ3) | 13.4% | 29.5% |
| Interquartile Range (IQR) | 6.5% | 23.1% |
| Standard Deviation (Sample) | 17.8% | 20.2% |
| Standard Deviation (Population) | 17.3% | 17.5% |
Similar Demographics by Unemployment Among Seniors over 75 years
Demographics Similar to Moroccans by Unemployment Among Seniors over 75 years
In terms of unemployment among seniors over 75 years, the demographic groups most similar to Moroccans are Immigrants from Latvia (7.8%, a difference of 0.050%), Potawatomi (7.8%, a difference of 0.080%), Immigrants from Chile (7.8%, a difference of 0.11%), Bahamian (7.8%, a difference of 0.24%), and Immigrants from Egypt (7.9%, a difference of 0.31%).
| Demographics | Rating | Rank | Unemployment Among Seniors over 75 years |
| Immigrants | Spain | 100.0 /100 | #44 | Exceptional 7.8% |
| British West Indians | 100.0 /100 | #45 | Exceptional 7.8% |
| Immigrants | China | 100.0 /100 | #46 | Exceptional 7.8% |
| Creek | 100.0 /100 | #47 | Exceptional 7.8% |
| Immigrants | Chile | 100.0 /100 | #48 | Exceptional 7.8% |
| Potawatomi | 100.0 /100 | #49 | Exceptional 7.8% |
| Immigrants | Latvia | 100.0 /100 | #50 | Exceptional 7.8% |
| Moroccans | 100.0 /100 | #51 | Exceptional 7.8% |
| Bahamians | 100.0 /100 | #52 | Exceptional 7.8% |
| Immigrants | Egypt | 100.0 /100 | #53 | Exceptional 7.9% |
| Immigrants | Malaysia | 99.9 /100 | #54 | Exceptional 7.9% |
| Filipinos | 99.9 /100 | #55 | Exceptional 7.9% |
| Immigrants | Eastern Asia | 99.9 /100 | #56 | Exceptional 7.9% |
| Ottawa | 99.9 /100 | #57 | Exceptional 7.9% |
| Iranians | 99.9 /100 | #58 | Exceptional 7.9% |
Demographics Similar to Alsatians by Unemployment Among Seniors over 75 years
In terms of unemployment among seniors over 75 years, the demographic groups most similar to Alsatians are Hopi (6.3%, a difference of 2.6%), Cheyenne (5.9%, a difference of 2.9%), Chinese (5.9%, a difference of 3.5%), Crow (5.9%, a difference of 3.5%), and Immigrants from Armenia (6.5%, a difference of 6.5%).
| Demographics | Rating | Rank | Unemployment Among Seniors over 75 years |
| Crow | 100.0 /100 | #1 | Exceptional 5.9% |
| Chinese | 100.0 /100 | #2 | Exceptional 5.9% |
| Cheyenne | 100.0 /100 | #3 | Exceptional 5.9% |
| Alsatians | 100.0 /100 | #4 | Exceptional 6.1% |
| Hopi | 100.0 /100 | #5 | Exceptional 6.3% |
| Immigrants | Armenia | 100.0 /100 | #6 | Exceptional 6.5% |
| Spanish American Indians | 100.0 /100 | #7 | Exceptional 6.5% |
| Taiwanese | 100.0 /100 | #8 | Exceptional 6.6% |
| Soviet Union | 100.0 /100 | #9 | Exceptional 6.6% |
| Yuman | 100.0 /100 | #10 | Exceptional 6.7% |
| Immigrants | Grenada | 100.0 /100 | #11 | Exceptional 6.7% |
| Comanche | 100.0 /100 | #12 | Exceptional 6.7% |
| Immigrants | Congo | 100.0 /100 | #13 | Exceptional 6.7% |
| Ute | 100.0 /100 | #14 | Exceptional 6.8% |
| Icelanders | 100.0 /100 | #15 | Exceptional 7.0% |