Zimbabwean vs West Indian 6th Grade
COMPARE
Zimbabwean
West Indian
6th Grade
6th Grade Comparison
Zimbabweans
West Indians
97.6%
6TH GRADE
99.1/ 100
METRIC RATING
82nd/ 347
METRIC RANK
96.3%
6TH GRADE
0.2/ 100
METRIC RATING
269th/ 347
METRIC RANK
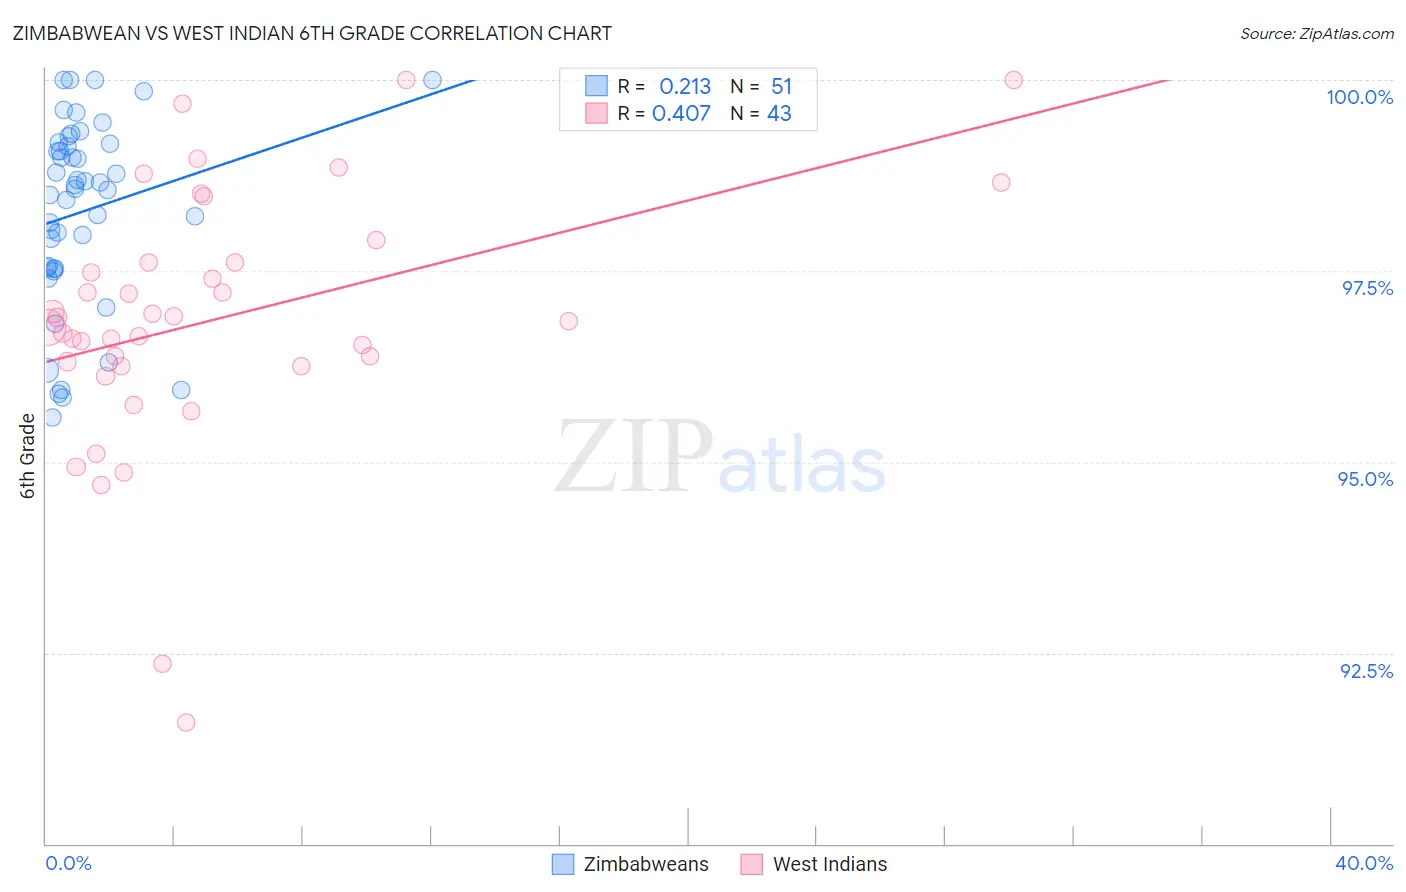
Zimbabwean vs West Indian 6th Grade Correlation Chart
The statistical analysis conducted on geographies consisting of 69,203,423 people shows a weak positive correlation between the proportion of Zimbabweans and percentage of population with at least 6th grade education in the United States with a correlation coefficient (R) of 0.213 and weighted average of 97.6%. Similarly, the statistical analysis conducted on geographies consisting of 254,059,006 people shows a moderate positive correlation between the proportion of West Indians and percentage of population with at least 6th grade education in the United States with a correlation coefficient (R) of 0.407 and weighted average of 96.3%, a difference of 1.3%.
6th Grade Correlation Summary
| Measurement | Zimbabwean | West Indian |
| Minimum | 95.6% | 91.6% |
| Maximum | 100.0% | 100.0% |
| Range | 4.4% | 8.4% |
| Mean | 98.3% | 96.9% |
| Median | 98.6% | 96.8% |
| Interquartile 25% (IQ1) | 97.5% | 96.3% |
| Interquartile 75% (IQ3) | 99.2% | 97.6% |
| Interquartile Range (IQR) | 1.6% | 1.4% |
| Standard Deviation (Sample) | 1.2% | 1.7% |
| Standard Deviation (Population) | 1.2% | 1.7% |
Similar Demographics by 6th Grade
Demographics Similar to Zimbabweans by 6th Grade
In terms of 6th grade, the demographic groups most similar to Zimbabweans are Lumbee (97.6%, a difference of 0.0%), Potawatomi (97.6%, a difference of 0.010%), Shoshone (97.6%, a difference of 0.010%), Immigrants from Lithuania (97.6%, a difference of 0.020%), and Icelander (97.6%, a difference of 0.020%).
| Demographics | Rating | Rank | 6th Grade |
| Ukrainians | 99.4 /100 | #75 | Exceptional 97.6% |
| Immigrants | England | 99.4 /100 | #76 | Exceptional 97.6% |
| Immigrants | Lithuania | 99.3 /100 | #77 | Exceptional 97.6% |
| Icelanders | 99.3 /100 | #78 | Exceptional 97.6% |
| Immigrants | India | 99.3 /100 | #79 | Exceptional 97.6% |
| Osage | 99.3 /100 | #80 | Exceptional 97.6% |
| Lumbee | 99.2 /100 | #81 | Exceptional 97.6% |
| Zimbabweans | 99.1 /100 | #82 | Exceptional 97.6% |
| Potawatomi | 99.1 /100 | #83 | Exceptional 97.6% |
| Shoshone | 99.0 /100 | #84 | Exceptional 97.6% |
| Delaware | 98.9 /100 | #85 | Exceptional 97.6% |
| Immigrants | Belgium | 98.9 /100 | #86 | Exceptional 97.5% |
| Puget Sound Salish | 98.9 /100 | #87 | Exceptional 97.5% |
| Immigrants | South Africa | 98.9 /100 | #88 | Exceptional 97.5% |
| Immigrants | Australia | 98.8 /100 | #89 | Exceptional 97.5% |
Demographics Similar to West Indians by 6th Grade
In terms of 6th grade, the demographic groups most similar to West Indians are Immigrants from Uzbekistan (96.3%, a difference of 0.0%), Immigrants from South America (96.3%, a difference of 0.0%), Immigrants from Hong Kong (96.3%, a difference of 0.010%), Ghanaian (96.4%, a difference of 0.030%), and Afghan (96.4%, a difference of 0.030%).
| Demographics | Rating | Rank | 6th Grade |
| Immigrants | Nigeria | 0.3 /100 | #262 | Tragic 96.4% |
| Immigrants | Colombia | 0.3 /100 | #263 | Tragic 96.4% |
| Armenians | 0.3 /100 | #264 | Tragic 96.4% |
| Immigrants | Jamaica | 0.2 /100 | #265 | Tragic 96.4% |
| Ghanaians | 0.2 /100 | #266 | Tragic 96.4% |
| Afghans | 0.2 /100 | #267 | Tragic 96.4% |
| Immigrants | Uzbekistan | 0.2 /100 | #268 | Tragic 96.3% |
| West Indians | 0.2 /100 | #269 | Tragic 96.3% |
| Immigrants | South America | 0.2 /100 | #270 | Tragic 96.3% |
| Immigrants | Hong Kong | 0.2 /100 | #271 | Tragic 96.3% |
| Immigrants | Bolivia | 0.1 /100 | #272 | Tragic 96.3% |
| Immigrants | Cameroon | 0.1 /100 | #273 | Tragic 96.3% |
| Immigrants | Philippines | 0.1 /100 | #274 | Tragic 96.3% |
| Immigrants | Ghana | 0.1 /100 | #275 | Tragic 96.3% |
| Yaqui | 0.1 /100 | #276 | Tragic 96.3% |