Mexican vs Turkish 11th Grade
COMPARE
Mexican
Turkish
11th Grade
11th Grade Comparison
Mexicans
Turks
86.1%
11TH GRADE
0.0/ 100
METRIC RATING
341st/ 347
METRIC RANK
94.0%
11TH GRADE
99.9/ 100
METRIC RATING
51st/ 347
METRIC RANK
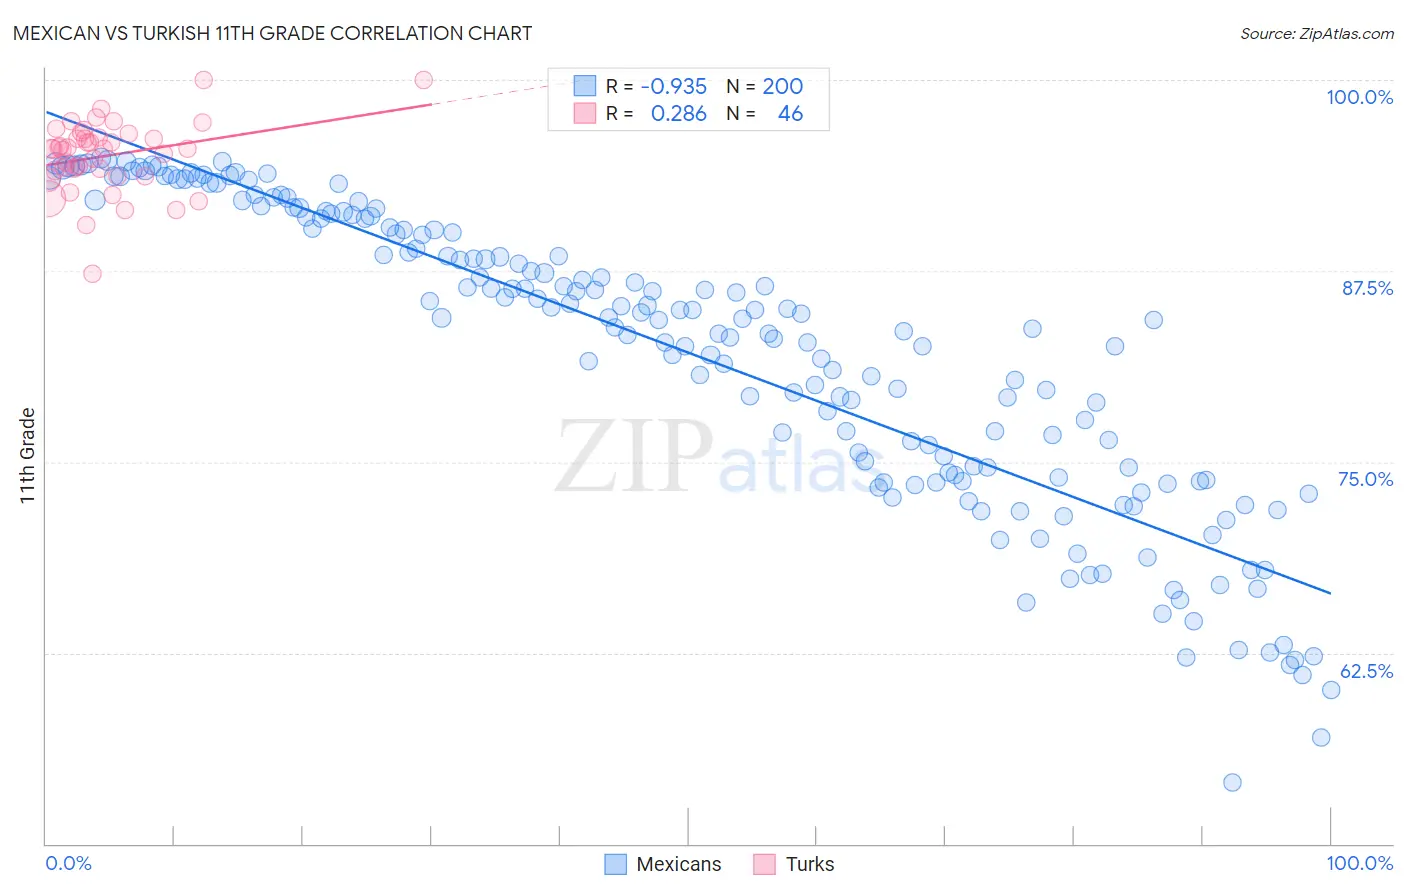
Mexican vs Turkish 11th Grade Correlation Chart
The statistical analysis conducted on geographies consisting of 565,338,951 people shows a near-perfect negative correlation between the proportion of Mexicans and percentage of population with at least 11th grade education in the United States with a correlation coefficient (R) of -0.935 and weighted average of 86.1%. Similarly, the statistical analysis conducted on geographies consisting of 271,864,104 people shows a weak positive correlation between the proportion of Turks and percentage of population with at least 11th grade education in the United States with a correlation coefficient (R) of 0.286 and weighted average of 94.0%, a difference of 9.2%.
11th Grade Correlation Summary
| Measurement | Mexican | Turkish |
| Minimum | 54.0% | 87.4% |
| Maximum | 94.9% | 100.0% |
| Range | 40.9% | 12.6% |
| Mean | 82.1% | 95.0% |
| Median | 84.4% | 95.5% |
| Interquartile 25% (IQ1) | 74.2% | 94.1% |
| Interquartile 75% (IQ3) | 90.9% | 96.2% |
| Interquartile Range (IQR) | 16.7% | 2.1% |
| Standard Deviation (Sample) | 9.8% | 2.3% |
| Standard Deviation (Population) | 9.7% | 2.3% |
Similar Demographics by 11th Grade
Demographics Similar to Mexicans by 11th Grade
In terms of 11th grade, the demographic groups most similar to Mexicans are Salvadoran (86.2%, a difference of 0.060%), Guatemalan (86.4%, a difference of 0.29%), Immigrants from Guatemala (85.8%, a difference of 0.33%), Immigrants from Latin America (86.8%, a difference of 0.78%), and Immigrants from Dominican Republic (86.9%, a difference of 0.91%).
| Demographics | Rating | Rank | 11th Grade |
| Immigrants | Yemen | 0.0 /100 | #333 | Tragic 87.1% |
| Houma | 0.0 /100 | #334 | Tragic 87.0% |
| Central Americans | 0.0 /100 | #335 | Tragic 86.9% |
| Immigrants | Dominican Republic | 0.0 /100 | #336 | Tragic 86.9% |
| Immigrants | Honduras | 0.0 /100 | #337 | Tragic 86.9% |
| Immigrants | Latin America | 0.0 /100 | #338 | Tragic 86.8% |
| Guatemalans | 0.0 /100 | #339 | Tragic 86.4% |
| Salvadorans | 0.0 /100 | #340 | Tragic 86.2% |
| Mexicans | 0.0 /100 | #341 | Tragic 86.1% |
| Immigrants | Guatemala | 0.0 /100 | #342 | Tragic 85.8% |
| Immigrants | El Salvador | 0.0 /100 | #343 | Tragic 85.3% |
| Yakama | 0.0 /100 | #344 | Tragic 85.0% |
| Immigrants | Central America | 0.0 /100 | #345 | Tragic 84.9% |
| Spanish American Indians | 0.0 /100 | #346 | Tragic 84.7% |
| Immigrants | Mexico | 0.0 /100 | #347 | Tragic 84.5% |
Demographics Similar to Turks by 11th Grade
In terms of 11th grade, the demographic groups most similar to Turks are Immigrants from Canada (94.0%, a difference of 0.010%), Immigrants from Australia (94.0%, a difference of 0.020%), Filipino (94.1%, a difference of 0.030%), Macedonian (94.1%, a difference of 0.030%), and Slavic (94.1%, a difference of 0.030%).
| Demographics | Rating | Rank | 11th Grade |
| Immigrants | Ireland | 99.9 /100 | #44 | Exceptional 94.1% |
| Australians | 99.9 /100 | #45 | Exceptional 94.1% |
| Serbians | 99.9 /100 | #46 | Exceptional 94.1% |
| Filipinos | 99.9 /100 | #47 | Exceptional 94.1% |
| Macedonians | 99.9 /100 | #48 | Exceptional 94.1% |
| Slavs | 99.9 /100 | #49 | Exceptional 94.1% |
| French | 99.9 /100 | #50 | Exceptional 94.1% |
| Turks | 99.9 /100 | #51 | Exceptional 94.0% |
| Immigrants | Canada | 99.9 /100 | #52 | Exceptional 94.0% |
| Immigrants | Australia | 99.9 /100 | #53 | Exceptional 94.0% |
| Immigrants | North America | 99.9 /100 | #54 | Exceptional 94.0% |
| Czechoslovakians | 99.9 /100 | #55 | Exceptional 94.0% |
| French Canadians | 99.9 /100 | #56 | Exceptional 94.0% |
| New Zealanders | 99.9 /100 | #57 | Exceptional 94.0% |
| Iranians | 99.9 /100 | #58 | Exceptional 94.0% |