Mexican vs Turkish Unemployment Among Ages 20 to 24 years
COMPARE
Mexican
Turkish
Unemployment Among Ages 20 to 24 years
Unemployment Among Ages 20 to 24 years Comparison
Mexicans
Turks
10.6%
UNEMPLOYMENT AMONG AGES 20 TO 24 YEARS
3.2/ 100
METRIC RATING
236th/ 347
METRIC RANK
10.3%
UNEMPLOYMENT AMONG AGES 20 TO 24 YEARS
55.2/ 100
METRIC RATING
170th/ 347
METRIC RANK
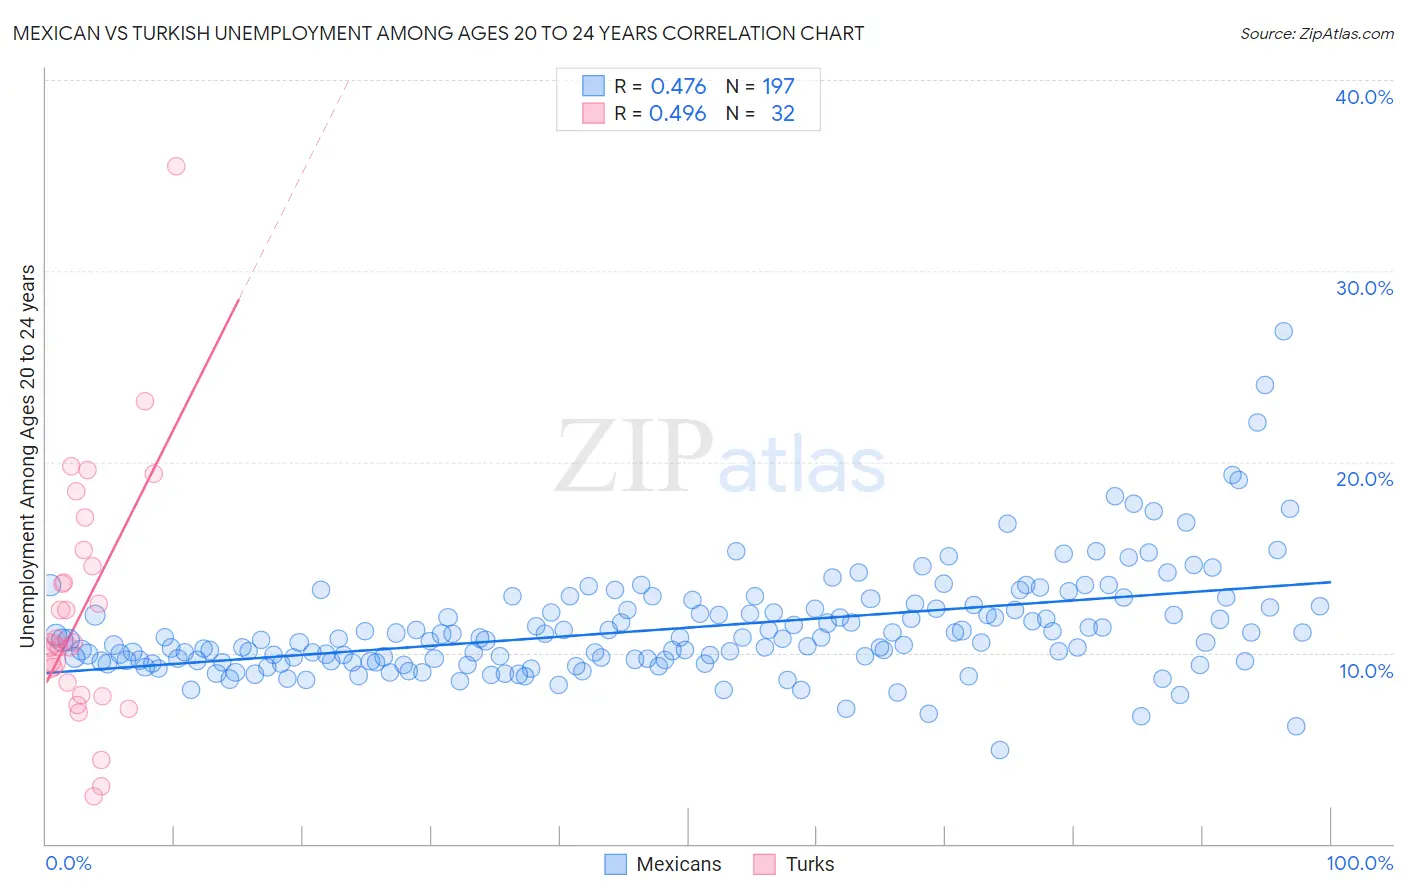
Mexican vs Turkish Unemployment Among Ages 20 to 24 years Correlation Chart
The statistical analysis conducted on geographies consisting of 521,721,977 people shows a moderate positive correlation between the proportion of Mexicans and unemployment rate among population between the ages 20 and 24 in the United States with a correlation coefficient (R) of 0.476 and weighted average of 10.6%. Similarly, the statistical analysis conducted on geographies consisting of 266,774,414 people shows a moderate positive correlation between the proportion of Turks and unemployment rate among population between the ages 20 and 24 in the United States with a correlation coefficient (R) of 0.496 and weighted average of 10.3%, a difference of 3.3%.
Unemployment Among Ages 20 to 24 years Correlation Summary
| Measurement | Mexican | Turkish |
| Minimum | 4.9% | 2.5% |
| Maximum | 26.9% | 35.5% |
| Range | 21.9% | 33.0% |
| Mean | 11.3% | 12.3% |
| Median | 10.7% | 10.5% |
| Interquartile 25% (IQ1) | 9.6% | 8.1% |
| Interquartile 75% (IQ3) | 12.3% | 15.0% |
| Interquartile Range (IQR) | 2.7% | 6.8% |
| Standard Deviation (Sample) | 2.8% | 6.5% |
| Standard Deviation (Population) | 2.8% | 6.4% |
Similar Demographics by Unemployment Among Ages 20 to 24 years
Demographics Similar to Mexicans by Unemployment Among Ages 20 to 24 years
In terms of unemployment among ages 20 to 24 years, the demographic groups most similar to Mexicans are Immigrants from Ukraine (10.6%, a difference of 0.040%), Immigrants from Africa (10.6%, a difference of 0.090%), Choctaw (10.6%, a difference of 0.11%), Israeli (10.6%, a difference of 0.13%), and Immigrants (10.6%, a difference of 0.17%).
| Demographics | Rating | Rank | Unemployment Among Ages 20 to 24 years |
| Americans | 4.4 /100 | #229 | Tragic 10.6% |
| French American Indians | 4.1 /100 | #230 | Tragic 10.6% |
| Native Hawaiians | 3.9 /100 | #231 | Tragic 10.6% |
| Israelis | 3.7 /100 | #232 | Tragic 10.6% |
| Choctaw | 3.6 /100 | #233 | Tragic 10.6% |
| Immigrants | Africa | 3.5 /100 | #234 | Tragic 10.6% |
| Immigrants | Ukraine | 3.3 /100 | #235 | Tragic 10.6% |
| Mexicans | 3.2 /100 | #236 | Tragic 10.6% |
| Immigrants | Immigrants | 2.7 /100 | #237 | Tragic 10.6% |
| Immigrants | Pakistan | 2.6 /100 | #238 | Tragic 10.6% |
| Salvadorans | 2.4 /100 | #239 | Tragic 10.7% |
| Immigrants | Central America | 2.0 /100 | #240 | Tragic 10.7% |
| Immigrants | El Salvador | 1.7 /100 | #241 | Tragic 10.7% |
| Moroccans | 1.4 /100 | #242 | Tragic 10.7% |
| Immigrants | Belarus | 1.3 /100 | #243 | Tragic 10.7% |
Demographics Similar to Turks by Unemployment Among Ages 20 to 24 years
In terms of unemployment among ages 20 to 24 years, the demographic groups most similar to Turks are Immigrants from Colombia (10.3%, a difference of 0.040%), Iraqi (10.3%, a difference of 0.060%), Immigrants from Fiji (10.3%, a difference of 0.090%), Immigrants from Eastern Asia (10.3%, a difference of 0.090%), and Italian (10.3%, a difference of 0.10%).
| Demographics | Rating | Rank | Unemployment Among Ages 20 to 24 years |
| Estonians | 61.1 /100 | #163 | Good 10.3% |
| Immigrants | Korea | 59.0 /100 | #164 | Average 10.3% |
| Lebanese | 58.3 /100 | #165 | Average 10.3% |
| Italians | 57.7 /100 | #166 | Average 10.3% |
| Immigrants | Fiji | 57.6 /100 | #167 | Average 10.3% |
| Iraqis | 56.7 /100 | #168 | Average 10.3% |
| Immigrants | Colombia | 56.3 /100 | #169 | Average 10.3% |
| Turks | 55.2 /100 | #170 | Average 10.3% |
| Immigrants | Eastern Asia | 52.7 /100 | #171 | Average 10.3% |
| Koreans | 51.9 /100 | #172 | Average 10.3% |
| Immigrants | Sweden | 50.8 /100 | #173 | Average 10.3% |
| Ukrainians | 50.0 /100 | #174 | Average 10.3% |
| Samoans | 45.4 /100 | #175 | Average 10.3% |
| Potawatomi | 42.0 /100 | #176 | Average 10.3% |
| Immigrants | Czechoslovakia | 40.8 /100 | #177 | Average 10.3% |